|
|
Basic Navigation
Overview of Dashboard Content and LayoutThe dashboard is split into two main columns, each containing two frames.
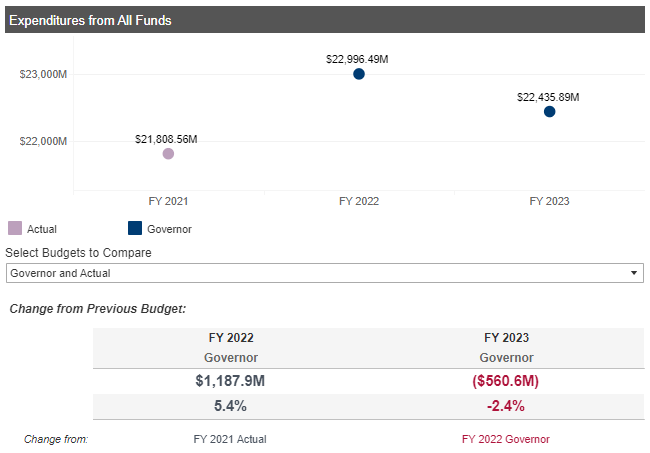
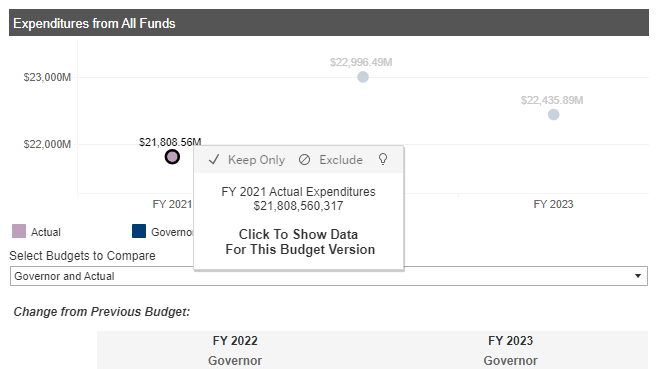
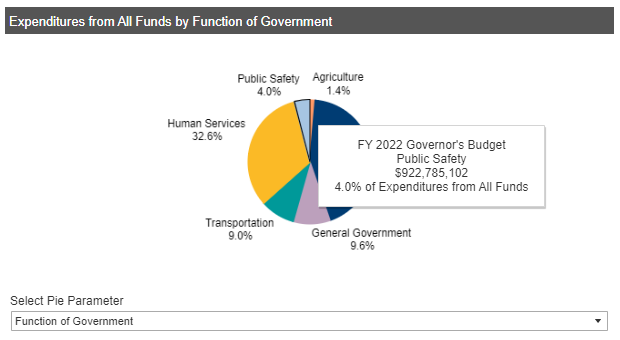
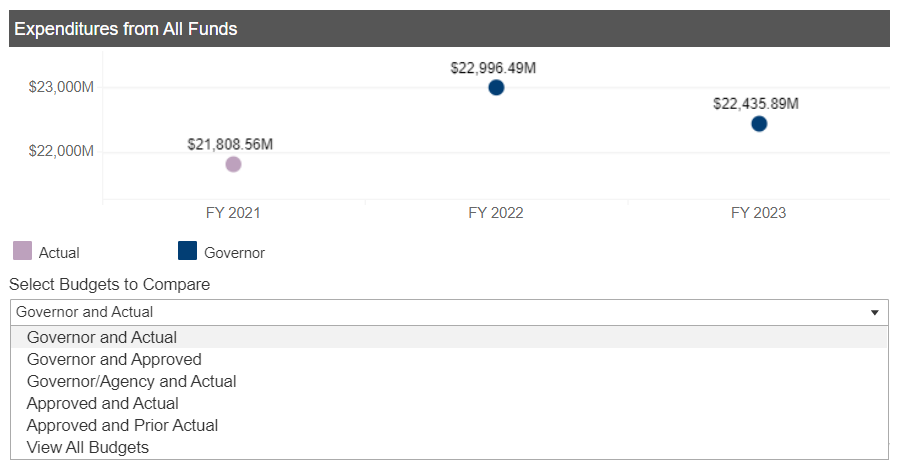
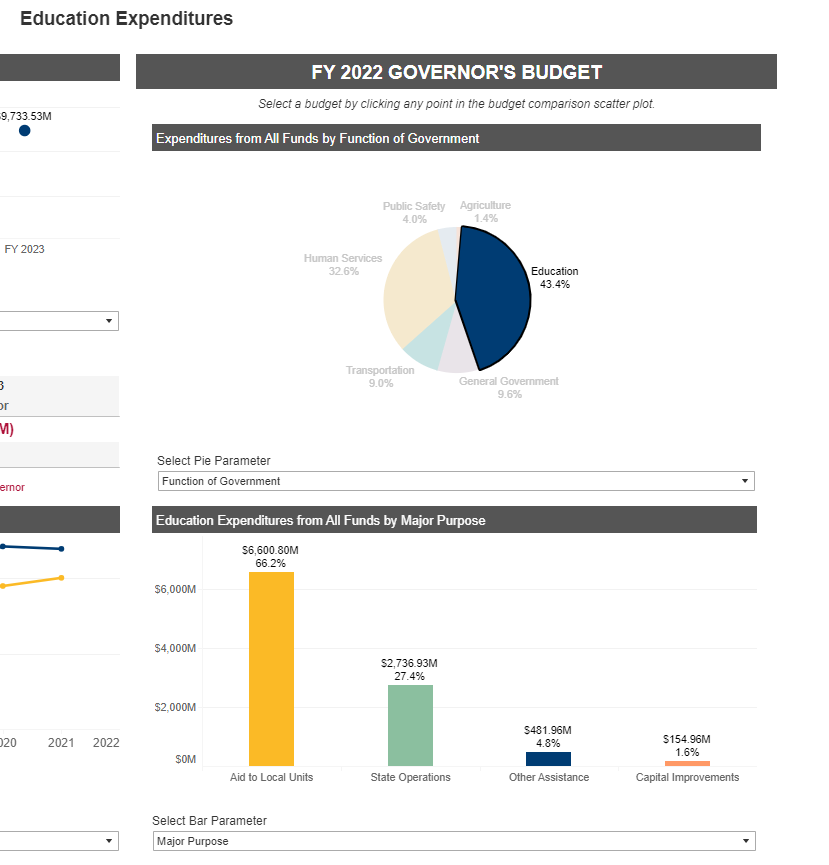
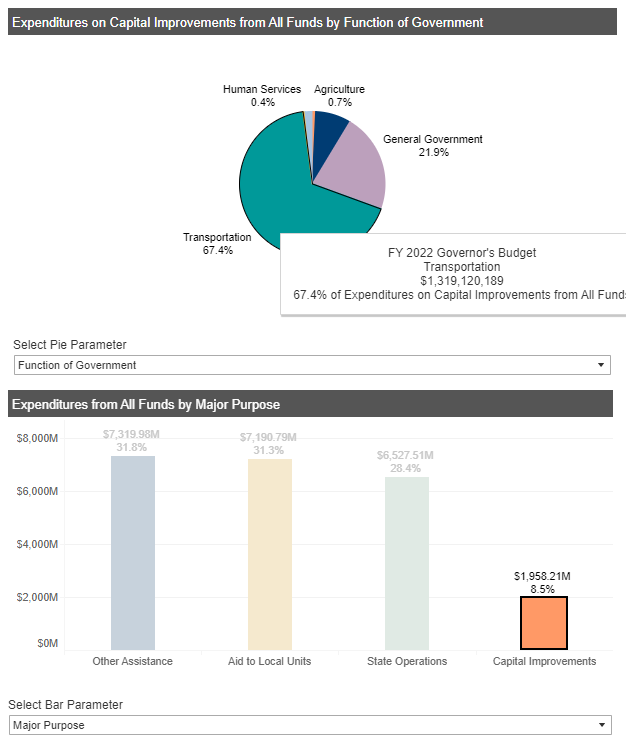
Selecting a Budget VersionFunctionality and InteractivityTooltips (hover-over content)
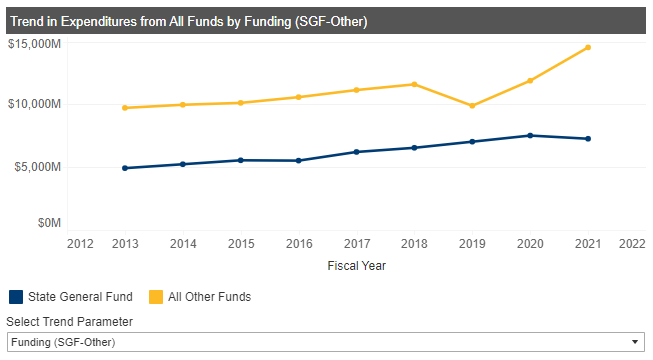
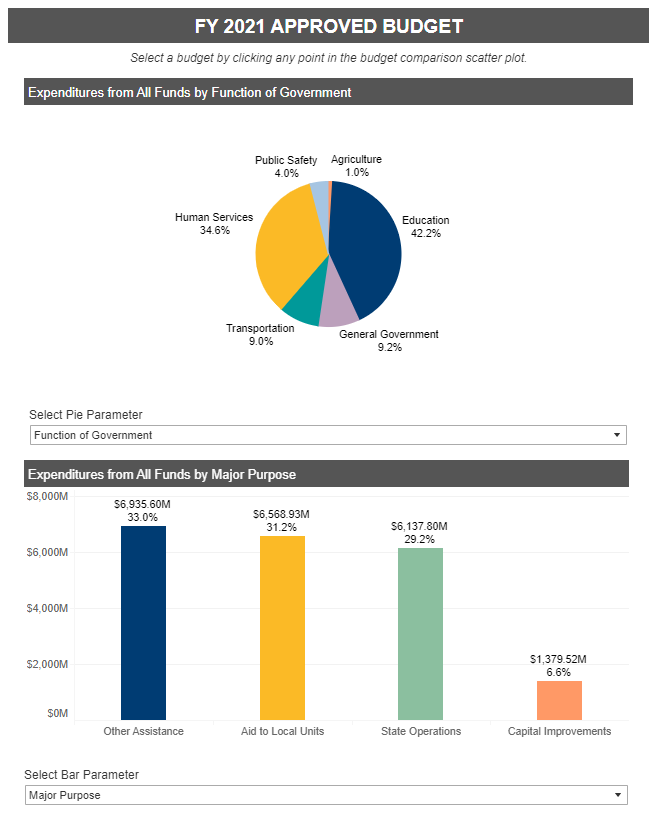
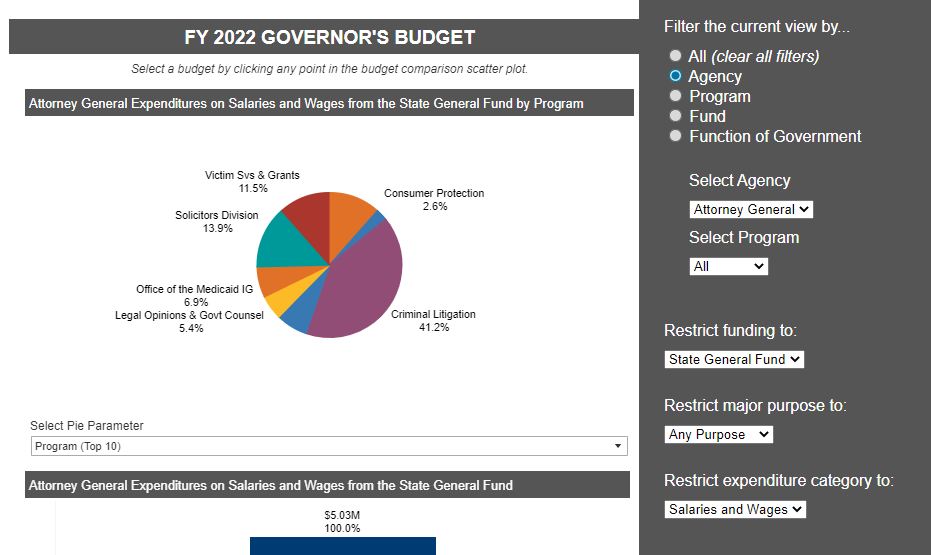
Parameter SelectionEach dashboard frame has a choice of parameters that allow the information to be displayed in different ways. These parameters may be changed independently of one another, allowing the user to explore budget data from a variety of perspectives.
Dynamic content filtering
Quick Filters menu
Clearing applied filters
Additional features
Sharing Dashboard Views
Sharing the current view
Exporting Images and DataTo export an image or dashboard data, click on the download icon Troubleshooting Common ProblemsProblem: I don't see any data.
Problem: I'm receiving the following error: "Uncaught SecurityError: Failed to read the 'sessionStorage' property from 'Window': Access is denied for this document."
Problem: I don't see the dashboard (charts and/or tables). There's a top KLRD banner for navigation, but the dashboard isn't loading.
Performance Based Budget InformationPlease direct general inquiries to kslegres@klrd.ks.gov Use the Quick Filters tab to filter information by agency/program and function of government. To navigate by function of government, clear all filters or select all agencies in the Quick Filters tab. To navigate by agency or function of government, clear all filters in the Quick Filters tab.
Jump to function of government:
Jump to agency:
Jump to program:
AGRICULTUREAGRICULTUREDepartment of AgricultureAdministrative ServicesProgram HistoryThe Kansas Department of Agriculture (KDA) is the nation's first department of agriculture, devoted to the total support of agriculture in Kansas. Crafted from the roots of the Kansas Agriculture Society and Kansas State Agricultural Society, dating back to 1855 and 1862, respectively, the State Board of Agriculture was officially created by the Kansas Legislature in 1872. It was not until 1994 that the Board was officially renamed the Kansas Department of Agriculture. In 2014, a majority of the department was relocated from Topeka to the current headquarters' location in Manhattan.
Consequences of Not Funding this ProgramThe Administrative Services program within KDA houses all of the support functions of the agency, as well as the Office of the Secretary. Without these integral functions, such as Fiscal, Human Resources, Information Technology (IT), Legal, and Communication, the agency would cease to function. Proper guidance and oversight for the entire agency is provided at this level and communicated to employees, stakeholders, and interested parties. Should this program not be funded, these duties would statutorily be required to be assumed by other state agencies or state employees. A large degree of synergism, education, and experience would be lost, as well as goodwill with the agricultural industry as a whole. The agency would jeopardize their ability to compete and receive top federal grant awards, causing further negative consequences to the agency. Program GoalsA. Provide timely, accurate, and efficient fiscal services (accounts payable and accounts receivable). B. Provide comprehensive Human Resources services to KDA employees and future KDA employees. C. Assist programs in the modernization of legacy IT services and continue to improve existing services. D. Provide timely, accurate, and efficient legal services (process administrative enforcement orders and settlement agreements). E. Provide open records to the public in a timely manner. F. Advocate for agriculture and KDA programs through traditional and other media. Performance Measures
Ag MarketingProgram HistoryThe Division of Agriculture Marketing, Advocacy and Outreach was originally created in the Board of Agriculture but was transferred to the Department of Commerce in 1995. In 2011, the division was transferred into the Department of Agriculture. The Division is organized into the following programs: Agriculture Workforce Development, Domestic Market Development, Compliance Education and Agency Outreach/Advocacy, Economist and Statistics, International Market Development and From the Land of Kansas/Affiliated Programs (local foods and farmers' markets). Additionally, the division has a 12-member Agriculture Marketing, Promotions and Advisory Board that meets quarterly and serves as a citizen sounding board for program activities.
Consequences of Not Funding this ProgramConsequences of not funding this program include: failure to meet statutory obligations as outlined below; loss of a voice for and support staff hired and trained to validate, promote and mentor/grow/expand Kansas agriculture (farmers, ranchers and agribusinesses/Ag Growth Strategy) domestically and internationally all while also serving a supply chain network associated with the direct, indirect and induced effects of the industry; loss of management oversight for the current KDA/Kansas Value Added Foods & Meat Laboratory partnerships designed to provide discounted services to Kansas food, beverage and meat processing/value add entities; dissolution of the state trademark program - From the Land of Kansas - and marketing initiatives/benefits (including eCommerce) offered through the program for farmers' markets and small/mid-sized food and agriculture entities; loss of securing and administering Federal funding associated with USDA AMS grants and USDA FAS market access/market development (International/federal cooperator partnerships); loss of agency economics and statistics validating the Kansas agriculture industry and data collection by statisticians contributing to feeder cattle indexes and hay/sunflower market pricing reports published by USDA AMS; loss of state/domestic agricultural advocacy initiatives including support for and engagement with secondary and post-secondary classrooms/audiences. Program GoalsA. Serve all Kansans through innovate programming and delivering solutions designed to create an environment that facilitates growth and expansion in agriculture while increasing pride in and awareness of the state's largest industry - agriculture. B. Increase the awareness of making Kansas a potential state for the relocation or expansion of agriculture business. C. Increase and enhance export opportunities for Kansas farmers, ranchers, and agribusinesses. Performance Measures
Animal HealthProgram HistoryKansas Department of Animal Health became a stand alone agency in 1969 by combining the Livestock Sanitary Commission and the State Brand Commission. Via a Governor's reorganization order, the Kansas Animal Health Department became a division of the Kansas Department of Agriculture in July 1, 2011. It is now know as the Kansas Division of Animal Health. Currently there are three programs that make up the Division - Animal Disease Control, Animal Facilities Inspection, Brands Program - all of which work to ensure the health and welfare of Kansas livestock and domestic animals.
Consequences of Not Funding this ProgramFunding sources are a combination of SGF, license and registration fees, USDA APHIS cooperative agreements, NADPRP farm bill funding, special program grants. Both farm bill funds and special program grants are project specific and provide opportunities for additional initiatives. Program GoalsA. Support division responsibilities, including disease investigation and response and maintain interaction with regulated industries and stakeholders. B. Enhance internal communication and professional development. C. Enhance animal disease emergency response capabilities. Performance Measures
ConservationProgram HistoryThe Division of Conservation, working with 105 local Conservation Districts, 75 organized Watershed Districts, other special-purpose districts, as well as state and federal entities administer programs to improve water quality, reduce soil erosion, conserve water, reduce flood potential and provide local water supply. The DOC has the responsibility to administer the Conservation Districts Law, the Watershed District Act and other statutes authorizing various programs.
Consequences of Not Funding this ProgramLack of funding for Division of Conservation programs would lead to greater soil erosion and loss of agricultural production which negatively impacts the Kansas economy, greater sediment and nutrient loading to streams and lakes which increases water treatment costs for municipalities and reduces water storage capacity, greater damage to crops, roads and structures caused by increased flooding, and the loss of 100+ full time positions with Conservation District staff across Kansas. Program GoalsA. Provide support for conservation districts. B. Increase in efficiency and effectiveness of State Water Plan program implementation/administration. C. Implement the State Water Plan and 50-Year Water Vision by addressing priority resource concerns through increase local technical assistance and targeted conservation practices with special initiatives and partnerships/cooperative grants/agreements. Performance Measures
Dairy & Feed SafetyProgram HistoryThe Dairy division within the old Board of Agriculture was established in 1925 within that same year the diary law was transferred to the State Board of Agriculture. The Dairy Inspection program protects consumers in Kansas and other states. Inspectors regulate the dairy industry starting at the farm and continuing as the milk and milk products are transported, process, distributed and sold. The Feed Inspection program safeguards both human and animal health by inspecting feed manufacturers, transporters, distributors/retailers and animal production facilities to ensure compliance with state and federal regulations.
Consequences of Not Funding this ProgramInspections and sampling would not be performed, increasing risk of milk product and commercial feed contamination, and/or adulteration putting public health and animal health at risk. Illness and death could result. Kansas milk and dairy products could not be shipped or sold in interstate commerce. Kansas feed manufacturers would not comply with FSMA requirements and could not export feed stuffs. Program GoalsA. Provide a fair-minded regulatory environment for the Kansas dairy and commercial feed industry which results in safe, clean, unadulterated milk, dairy, and commercial feed products for both animal and human feed consumers. B. Achieve and maintain compliance with FDA guidelines and National standards. C. Grain program efficiencies by continuing to automate and streamline inspection, sampling, and record-keeping processes. Performance Measures
Food SafetyProgram HistoryFood inspection regulation dates back to the early 1900s and traditionally under KDHE. In 2003, the Legislative Division of Post Audit studied Kansas' food inspections and as a result, food inspection was moved to the Department of Agriculture in 2004 with lodging inspections following in 2008. This was done to place all food regulation under Department of Agriculture which was already doing meat, poultry, dairy, and egg inspections. A number of efficiencies were gained and continues to present.
Consequences of Not Funding this ProgramProviding uniform food safety inspections in food establishments and food processing plants ensures a safe food supply to Kansas consumers. Failure to provide these inspections and regulate these food and lodging facilities under standard federal guidelines would significantly increase the risk of the consuming public and be detrimental to public health including possible death due to unsanitary food preparation conditions. Program GoalsA. Provide uniform, effective, and efficient food safety inspections in order to protect public health and maintain the public's confidence in Kansas establishments. B. Professional development of Food Safety & Lodging program staff. C. Maintain outreach to customers through training and educational meetings. Performance Measures
Grain WarehouseProgram HistoryIn 1907, Kansas enacted its first warehousing laws. The early farmers recognized the need for government to regulate the grain industry much in the same way it regulated banks. The primary goal for the program has not changed in more than 100 years. The Grain Warehouse Inspection program administers and enforces the Kansas Public Warehouse Law relating to grain storage. It requires that any entity that stores grain for the public be licensed by either the state or federal government. It ensures that Kansas grain producers have safe, solvent warehouses where they may store their commodities. To achieve this, the program examines state-licensed facilities at least once each year. More examinations are made on licensed facilities that meet only the minimum financial requirements. A licensed elevator, with the approval of the Grain Warehouse Inspection program, may move open stored grain to another licensed, bonded terminal elevator. This allows smaller facilities to free up bin space for the next harvest. Also, with approval from the program, licensed facilities may use emergency or conditional storage space during harvest when storage space is in short supply. This allows the elevator to better serve Kansas crop producers. Examinations help eliminate fraud in the grain industry, ensure the quantity of stored commodities in Kansas licensed warehouses, maintain the percentage of loss to producers at zero.
Consequences of Not Funding this ProgramDefunding the Grain Warehouse program will have a significant negative effect on the Kansas economy by not ensuring that Kansas grain producers have safe, solvent warehouses where they may store their commodities as required by state statute. Program GoalsA. Protect grain depositors by performing subsequent exams of all licensed public grain warehouses once a year to ensure there are no losses due to fraud or mismanagement of records and grain quality is kept to the standards set forth by the State of Kansas. B. Provide a high level of customer service by completing special examinations when requested and measuring new facilities to add to licensed storage space or approve conditional storage space. C. Accelerated examinations for noncompliance to maintain a system that ensures zero loss to depositors by identifying and deterring fraud in the grain warehouse industry. D. Professional Development. Performance Measures
LaboratoryProgram HistoryStarted 1953 to ensure quality of fertilizers, seeds (former), animal feeds, dairy products, livestock remedies (former), pesticides; Metrology lab was established in 1971; Added: meat and poultry, metrology, industrial hemp; Relocated lab during pandemic from Topeka to Manhattan in March 2020.
Consequences of Not Funding this ProgramAgricultural products and commodities that pose a public health/safety hazard would likely result in foodborne or feedborne illness. Lack of fairness in commerce from inaccurate weighing and measuring devices or improperly labeled feeds, fertilizers, and pesticides. Program GoalsA. Protect consumer and animal health through multiple chemical and microbiological analyses of various food products sold in Kansas. B. Evaluate ongoing technical competency of analysts through completion of proficiency testing. C. Professional development of laboratory staff. Performance Measures
Meat and PoultryProgram HistoryKansas Meat and Poultry Inspection Program started in 1969 under the Kansas Department of Agriculture when the Meat and Poultry Inspection Act was created.
Consequences of Not Funding this ProgramKansas would be non-compliant with Federal law for meat inspection and we would loose federal funding. Either USDA would have to provide inspection services or meat processing could not continue. In the absence of inspection, meat and poultry products that pose a food safety hazard may enter the human food supply. Product adulteration and the incidence of economic fraud would have to be reported and investigated by another agency or not addressed. Program GoalsA. Provide a fair-minded regulatory environment to the Kansas meat and poultry inspection industry to ensure our "equal to" status with FSIS. B. Ensure that required sampling is done during the calendar year. C. Facilitate growth and education to new and existing businesses. Performance Measures
Pesticide & FertilizerProgram HistoryThe Pesticide and Fertilizer Program works to ensure compliance with Kansas statutes and regulations governing products that are used to control pests or to enhance plant growth. The Program strives to achieve its mission through compliance assistance and outreach education; complaint investigation; and monitoring inspections. The Kansas Department of Agriculture has been responsible for pesticide and fertilizer regulation since the implementation of the various statutes identified above. In approximately 1999, the Pesticide and Fertilizer Program was integrated after the fertilizer section was transferred from the Agricultural Commodity Assurance Program.
Consequences of Not Funding this ProgramThe Pesticide and Fertilizer Program needs funding to ensure it meets its statutory and regulatory duties. If the Pesticide and Fertilizer Program is not funded and the statutory and regulatory duties are not met, it is likely that pesticide misuse complaints would increase and such complaints would not be investigated; consumers would not know if a product was properly registered in Kansas; and there would be no oversight of chemigation process which may result in an increased likelihood of groundwater contamination. Additionally, not adequately funding the Pesticide and Fertilizer Program may result in Kansas losing primacy under the Federal Insecticide, Fungicide and Rodenticide Act (FIFRA) which would likely increase the presence of the U.S. Environmental Protection Agency (EPA) in the state, including additional federal enforcement actions being pursued against Kansas businesses. Program GoalsA. Efficiently apply state resources to provide an equitable and balanced regulatory environment. B. Maintain Kansas primacy under the Federal Insecticide, Fungicide, and Rodenticide Act to facilitate Kansas agriculture and restrict federal enforcement for noncompliance by Kansas pesticide business. C. Grain program efficiencies by continuing to develop and streamline the Agriculture Information Management System (AIMS) to provide online opportunities for licensure and product registration. Performance Measures
Plant Protection & Weed ControlProgram HistoryThe purpose of the Plant Protection and Weed Control program is to: protect the state's native and cultivated plants from the introduction and outbreak of harmful plant pests, including insects, plant diseases, weeds and other organisms; provide inspection and certification services to ensure compliance with statutes and quarantines and to facilitate movement of plants and plant products to other states and countries; manage pests of regulatory significance within the state; ensure that plants, plant products, and seed offered for sale in Kansas meet the requirements of the Plant Pest and Agricultural Commodity Act, the Kansas Seed Law, the Kansas Noxious Weed Law, and the Commercial Industrial Hemp Act.
Consequences of Not Funding this ProgramDefunding the Plant Protection and Weed Control program will have a significant negative effect on the Kansas economy. Important plant safeguarding, export certification, consumer protection, and industrial hemp licensing activities will not be completed as require by state statute. Program GoalsA. Safeguarding: Provide a system to safeguard Kansas' native and cultivated resources by excluding and/or early detection of high-profile exotic pests of regulatory significance which also allow the continued export of Kansas-produced plants and plant products. B. Export Commodity Assurance: Provide export commodity assurance for Kansas-produced commodities so that the pest freedom requirements by other states and foreign countries are maintained to allow expeditious movement of those commodities in foreign and domestic trade. C. Pest Management: Manage, control, or eradicate select pest of regulatory significance that are established in the state and provide technical expertise to program cooperators involved in pest control. D. Ensure that seed offered for sale meets label guarantees and contains no noxious weeds or restricted weed seed exceeding allowed quantities. E. Industrial Hemp Program: Enabling Kansans to take advantage of the new alternative crop in Kansas. F. Staff Training: Professional development and internal training. Performance Measures
Water AppropriationsProgram HistoryWe administer the Water Appropriation Act which allocates water to our citizens with terms, conditions, and limitations that provides a framework of first in time is first in right to the water. This allocation method maximizes the use of water for the best economic benefit and protects private property rights.
Consequences of Not Funding this ProgramCertificates, permits, changes to water rights, would not be processed and issued. Water use reporting data would not be collected. Private property rights would not be protected. The state's economy would be hurt by not allowing water to be put to a beneficial use. Some water users would take advantage of their neighbors by using more water than authorized. Program GoalsA. Process applications to appropriate water and changes to existing water rights in Kansas. B. Ensure water rights and the resources are protected. C. Conduct field work, public outreach, and transparent rule development. Performance Measures
Water ManagementProgram HistoryThe water management services program is responsible to administer the state's four interstate river compacts, provide technical assistance to the water appropriation program, evaluate complex hydrologic scenarios to enhance water management, investigate groundwater impairment claims, and maintain and enhance the official water rights information database.
Consequences of Not Funding this ProgramNot funding this program would severely jeopardize Kansas's ability to secure its water supply from Colorado on the Arkansas River, and from Colorado and Nebraska on the Republican River. Not funding this program would also eliminate the agency's ability to use state of the art hydrologic modeling and analysis tools to develop, implement, and evaluate water management tools and strategies leading to poor management of water resources and economic harm to local and regional economies. Program GoalsA. Protect Kansas water supplies through administering the KS-CO Arkansas River Compact. B. Protect Kansas water supplies through administering the KS-CO-NE Republican River Compact. C. Continue to encourage the development and use of sound science to inform water management decisions. Performance Measures
Water StructuresProgram HistoryThe Water Structures Program reviews projects that involve dams, stream modifications, levees, floodplain fills and provides technical assistance and coordination for local communities participating in the National Flood Insurance Program for the protection of property and public safety. These duties were authorized starting in 1929 with the passage of the Obstructions in Streams Act and Levee Law.
Consequences of Not Funding this ProgramSevere private and public property damage or loss of life could occur due to failure of aging dams and other water structures, inappropriate floodplain development or poor construction of water structures. Private property rights could be infringed upon by neighbors constructing dams or other structures that are not properly designed. The citizens of Kansas would not be able to participate in the NFIP to help cover loss costs associated with disasters. Perspective property buyers and current owners would not have accurate data on flooding risks. Program GoalsA. Regulate dams, stream modifications, levee and floodplain fills for the protection of life, property, and public safety. B. Ensure effective community engagement and risk communication. C. Increase public awareness of floodplain management, stream obstructions, and channel changes. Performance Measures
Weights & MeasuresProgram HistoryKDA inspects all retail fuel devices every 18 months, these devices have a compliance rate around 90%. Other commercial devices such as scales, non-fuel meters, propane meters, moisture meters etc. are required to be inspected annually by a licensed service company, these devices have a compliance rate around 50%. KDA inspects a small portion of all non fuel devices on an annual basis. Do to the reliance on private service companies KDA no longer has the equipment or staffing to perform inspections of all device types and has not kept pace with new technology entering the market place such as Mass Flow Meters, Electric Vehicle Charging stations, Grain Moisture Meters, etc.
Consequences of Not Funding this ProgramWeights and Measures provides traceability for Kansas Weighing and Measuring Devices to the National System of Weights and Measures Standards and Performance Testing. This ensures equity in the marketplace for Kansans and facilitates trade locally, nationally and internationally. Failure to maintain accurate weighing and measuring devices harms Kansan's, both purchasers and sellers. This harm is economic and results in many millions of dollars in lost revenue annually for Kansans. If trust in the weighing and measuring system is lost it could also result in lost trade and/or the requirement for traded items to be weighed elsewhere which would add additional cost for businesses. As an example there are some scales in Kansas over which several billion dollars of beef are traded annually. For a single scale trading 3 billion dollars of beef, a 0.1% error would result in 3 million dollars of lost revenue to either the beef producers selling beef or to the packing plant buying it. While we don't have the data to determine the value of all products sold annually in Kansas, it is easy to see how very small errors can have significant revenue impacts for Kansans irregardless of the product, beef, grain, oil, fuel, steel, gravel, cement, milk, chemicals, etc. Program GoalsA. Utilize available resources efficiently. B. Improve compliance education. C. Improve program coverage. Performance Measures
Department of Wildlife & ParksAdministrationProgram HistoryThe administration division has historically been split between the Pratt office and the Secretary's office in Topeka. This division contains the Licensing, Purchasing, accounting, budget, Legal, and IT sections of the Department. This is the division that makes the agency function.
Consequences of Not Funding this ProgramAll accounting, Budget, purchasing, licensing, Legal, Public Affairs, and IT functions are accounted in this division Program GoalsA. To provide accurate and timely accounting practices to the agency. B. To provide a quality and reliable platform for licenses and permits to be sold to the public and to maintain historical data to predict license trends. C. To provide accurate and timely information and purchasing services to our internal customers. To provide internal customers the information required to make an acceptable service. To process and track all purchases made by the Agency. D. To publish and distribute accurate information in a timely manner that is informative and meaningful. Performance Measures
Ecological ServicesProgram HistoryThe Ecological Services Section was established in 1987 during the reorganization of Fish and Game Commission and the Parks Resource Authority to one department. The section was developed to provide technical input to many agricultural and nonagricultural related projects. The addition of both federal and state environmental protection laws such as the National Environmental Policy Acts and federal Clean Water laws and regulations mandated that KDWP become more actively involved as the voice of the state's wildlife resources. The passing of the federal Endangered Species Act of 1973 and subsequent passing of the Kansas Nongame and Endangered Species Act in 1975 mandated additional KDWP involvement with project reviews and the development of the nongame, threatened and endangered species program in the state. Subsequent state laws (Water Project Environmental Coordination Act KSA 82a-325 to 327) requires review of water projects in the state and their impacts to other natural resources including threatened and endangered species. In 2005, Ecological Services Section developed the first State Wildlife Action Plan, a plan developed to keep common species common by conserving wildlife and habitat before they become to rare and costly to restore. Through this process a list of species of greatest conservation need was developed and is the cornerstone to receiving federally funding from the State Wildlife Grants Program. The Ecological Services Section is responsible for programs related to non-game, threatened and endangered species, biodiversity, watchable wildlife, climate change (including alternative energy development), and private lands management. The section is responsible for administering State Wildlife Grants (both appropriated and competitive grant funds), Section 6 cooperative agreement and grants, Cooperative Service Agreements with the USFWS and the Chickadee Checkoff Program. The section is also responsible for upholding the threatened and endangered species project review program pursuant to the Kansas Nongame and Endangered Species Act of 1975. In addition, the section is responsible for addressing a diverse array of wildlife interest ranging from T&E to watchable wildlife. Programmatic objectives involve developing collaborative partnerships and committees (e.g. Kansas Nongame Advisory Council, T&E Task Force, Teaming With Wildlife)as well as the development and implementation of the State Wildlife Action Plan (SWAP).
Consequences of Not Funding this ProgramNegative impacts to critical habitats for state listed threatened and endangered species could cause additional decline in population levels that could cause extirpation of the species from the state. Without the review and permitting process for impacts to wildlife additional species could be added to the Federal endangered species list and thus removing jurisdiction from state to federal authority. Part of this reviews includes reviews all KDWP grants for compliance and non-compliance with state and federal laws (Section 7 consultation and NEPA) which without this measure could result in the loss of federal funding for conservation programs agency wide. These reviews are completed in house to reduce cost for the agency that may be required to conduct environmental assessments for each grant funded project causing increased cost per project. Administration of the Section 6 Cooperative Agreement with US Fish and Willdife Service is also within the sections duties and without this agreement being maintained each year the state wildlife agency would be in further non compliance with the Federal ESA. Program GoalsA. Conduct project reviews for activities that impact fish and wildlife resources. Reviews are conducted on projects carried out by private individuals, industry, local,, state and federal governments as allowed under statute and regulations. Performance Measures
Education DivisionProgram HistoryNearing a 50 year anniversary and one of the most successful outdoor education programs delivered by the Kansas Department of Wildlife and Parks, the Hunter Education program was created in 1973 and owes this success to the dedicated Kansas hunter education instructors that teach this program. The program funding is made possible through the excise taxes collected on hunting and shooting equipment (Pittman Robertson Act) which pays for classroom materials and training equipment. The Pratt Education Center was converted from the first fish culture school of Kansas University, built in 1913, into the agency's first nature center, established in 1966. Located in the Flint Hills, the Milford Nature Center was built adjacent to the Milford fish hatchery and opened its doors in 1991. The Great Plains Nature Center, the result of a partnership between KDWP, the friends of the Great Plains Nature Center, the US Fish and Wildlife Service and the City of Wichita, opened its doors in 1996. The Kansas Wetlands Education Center, a partnership between KDWP and Fort Hays State University, opened in 2009. In 2013, KDWP took over operations of the Southeast Kansas Nature Center through a lease agreement with the city of Galena.
Consequences of Not Funding this ProgramThe consequenses of not funding this program include the loss of long standing and integral education programs such as hunter education and outdoor skills workshops, as well as the five nature and wildlife education centers in Kansas. Program GoalsA. Connect people to the KDWP mission through strategies to engage with and support customers with broad experiences and backgrounds as they participate in and enjoy the outdoor opportunities of Kansas. B. To produce safe, knowledgeable, responsible and legal hunters and fur harvesters who will support wildlife management strategies that produce healthy populations of wildlife for the enjoyment of the people of Kansas, and to assist all individuals in developing awareness, knowledge, skills and commitment to result in safe, responsible behavior and actions concerning the use of Kansas' wildlife resources. C. Inspire life-long learning through outdoor skills programs and outreach efforts designed to enhance the knowledge, understanding and appreciation of Kansas' natural resources. Performance Measures
FisheriesProgram HistoryThe Fisheries Division is responsible for maintaining and creating fishing opportunity and improving fishing quality across the state. It is also responsible for conserving and enhancing fisheries resources. Fisheries Division programs are tailored to meet the special needs of anglers. For example, the Urban Fishing Program provides fishing in areas where demand for fish exceeds supply by stocking catchable size fish throughout the fishing season. On the other end of the spectrum is the lack of public water in western counties. The Department's private water leasing program is designed to create new fishing opportunities in portions of the state that are under served. The fisheries program strives to respond to the needs of all anglers regardless of their location.
Consequences of Not Funding this ProgramA dramatic reduction of fishing opportunity in Kansas. Jeopardize the fate of an estimated 400,000 anglers that spend approximately $295 million dollars in Kansas each year. A predictable loss of sport fish that experience poor natural recruitment on their own due to degradation of habitat. Further degradation of habitat due to lack of manpower and funding to mitigate these issues. Loss of human respect and stewardship of our natural resources and heritage. Program GoalsA. The Fisheries Division goals are to Conserve Kansas sport, non-sport, and threatened and endangered fishes, the water they rely on, and their habitats. B. Increase fishing opportunity. Increase fishing success. Performance Measures
Law EnforcementProgram HistoryThe Law Enforcement Division is responsible for the statewide enforcement of state and federal fish and wildlife laws, boating laws, and public lands regulations. These enforcement activities occur on private and publicly owned lands within the state. In addition to these primary law enforcement duties, these officers also assist federal, state and local law enforcement agencies in a support role when requested. Their assistance is provided for warrant service and arrest of wanted fugitives, enforcement of controlled substance laws, and response to emergency management. The Division also plays an active role in providing information and educational programs concerning hunter education, boating safety, and other natural resources related programs.
Program GoalsA. Provide public health & safety for all public lands users through pro-active management and law enforcement. Performance Measures
ParksProgram HistoryIn 1955, the Kansas Legislature adopted a public policy providing for state parks and facilities by creating the Kansas Parks and Resources Authority. In 1958, they appropriated funds for operations and created Kanopolis State Park. Additional parks were added legislatively by statute as years passed, and in 1987 Governor Mike Hayden merged the Kansas Parks and Resources Authority and the Kansas Fish and Game Commission into the Kansas Department of Wildlife and Parks. Governor Sam Brownback added Tourism to the Department in 2011. The Parks Division is responsible management and operations of 28 designated state parks, including Little Jerusalem Badlands State Park and Flint Hills Trail State Park. These areas include 8,000 acres of maintained lawn grass, 32,200 acres of park-land resources, over 510 miles of trails, over 280 miles of roads, more than 10,000 campsites, 35,000 acres of recreational surface water, over 1,000 structures; complete sewer systems including 81 lagoons, over 160 lift stations with 2 pumps each and treatment plants; 24 potable water systems, and more than 3,000 miles of utility lines. The Division expects over 7 million visitors this year. On average, each employee is responsible for 74,000 visitors annually. A major effort is placed on public safety, law enforcement and providing a family atmosphere where children and adults can have an enjoyable, safe experience. Over 220 special events are provided annually that enhance quality-of-life experiences for our visitors and generate significant economic impact for surrounding communities and the state
Consequences of Not Funding this ProgramManagement of the 25 state parks and the prairie spirit trail would be lost. Program GoalsA. To effectively manage, protect, and administer the state's parks, its visitors, and associated wildlife efficiently, while providing a diversity of quality outdoor recreation experiences with special regards toward natural resource protection. B. To promote Kansas' quality outdoor recreation activities and quality of life experiences. C. To enhance the public's knowledge of the importance of outdoor recreation to the Kansas economy. Performance Measures
Public Lands MeasuresProgram HistoryIn 1926 the first state fishing lakes were constructed at Neosho and Meade. The first public land acquisition occurred in 1939 for the Finney Game Refuge utilizing Pittman-Robertson federal aid funds. In 1942, acquisition of land for public hunting access began at Cheyenne Bottoms Wildlife Area. This was the beggining of public access areas for hunting and fishing in the State of Kansas. The Public Land Division is responsible for the management of 412,000 acres of public land and water; this represents approximately one percent of the land base of Kansas. The primary responsibility is to provide a multitude of diverse habitats for wildlife species of Kansas. The public lands program is funded solely by the Wildlife Fee Fund and revenue generated from management activities that benefit wildlife. Ninety percent of all hunters and fishermen in Kansas will spend part of their hunting and fishing activities, on public land or water within any one year. The heavy use by hunters and fishermen requires safe and sanitary facilities on wildlife areas and state fishing lakes. The Public Lands program is responsible for the management of 129 projects. These projects are funded from the Wildlife Fee Fund and some are included in the U.S. Fish and Wildlife Service Sport Fish and Wildlife Restoration Programs that reimburses up to 75 percent of approved activities designed to benefit fish and wildlife and hunters and anglers. These properties annually receive approximately four million plus, visitation-days by hunters, anglers and wildlife viewers. Vehicles and equipment will be replaced according to replacement schedules and need. Upgrades will be examined on overall benefit and effectiveness to enhance operations and safety. Temporary and seasonal employees will supplement the work loads placed on FTE's, during heavy use periods and activities that require assistance. Operations and maintenance expenditures are adequate to maintain minimal standards, and replace some worn-out equipment.
Consequences of Not Funding this ProgramLoss of habitat, loss of diversity, reduction in stable wildlife populations. Decline in outdoor recreation participation by public. Outdoor activities have been shown to have physical and mental health benefits and promote community interaction and resource appreciation. Negative socio-economic impact both at a local and statewide level due to low hunting/fishing participation, resource visitation, and reduced spending at associated industries. Program GoalsA. To Optimize public access for hunters, anglers, and other compatible recreational opportunities; Conserve, manage, and optimize wildlife and their habitats. B. Provide appropriate infrastructure to support hunting, fishing, and other compatible recreational opportunities. C. Provide public health and safety for all public lands users through pro-active management and law enforcement. Performance Measures
WildlifeProgram HistoryThe Wildlife Division includes research and surveys, and management. Wildlife Division projects are funded from the wildlife fee fund. Most projects qualify for 75 percent reimbursement through the U.S. Fish and Wildlife Service federal aid to Wildlife Restoration Program. The research and survey program provides projects that measure trends in big game, upland game birds, migratory game birds, and furbearers. Harvest, hunter success and human dimensions information are obtained from hunter surveys. Information provides the basis for objective administration of seasons, permit quotas, regulations and management program planning. Research targeting specific wildlife management problems or environmental issues are accomplished within this section. Contracting for professional services is the primary means for accomplishing research objectives. The wildlife management program provides for a statewide initiative to improve upland game populations by improving upland game habitat. The walk-in-hunting-access program (WIHA) designed to lease private land for public hunting access is coordinated by management personnel. Other operations include assistance to public land management, agricultural liaison, animal damage control, species reintroduction, animal rehabilitation, and interaction with other governmental and private organizations concerning wildlife management.
Consequences of Not Funding this ProgramLoss of habitat, loss of diversity, reduction in stable wildlife populations. Decline in outdoor recreation participation by public. Outdoor activities have been shown to have physical and mental health benefits and promote community interaction and resource appreciation. Negative socio-economic impact both at a local and statewide level due to low hunting/fishing participation, resource visitation, and reduced spending at associated industries. Program GoalsA. To monitor wildlife populations and their habitats, and to assess public appreciation, demand and tolerance for wildlife resources and department programs. B. Provide programs designed to conserve, protect and enhance wildlife habitat. C. Provide wildlife related recreational opportunity. Performance Measures
Health & Environment--EnvironmentBureau of AirProgram HistoryIn 1985, the Kansas Legislature created the Kansas Asbestos Act to protect citizens and asbestos workers from exposure to this hazardous air pollutant. The Federal Government implemented the Clean Air Act in 1993 and Kansas implemented the Kansas Air Quality Act in 1993.
Consequences of Not Funding this ProgramAir program would be implemented by the Environmental Protection Agency in Kansas. Program GoalsA. Meet all National Ambient Air Quality Standards (NAAQS). B. Conduct air quality compliance inspections. C. Maintain an air permitting program for the State of Kansas (Average cost per permit). Performance Measures
Bureau of Environmental RemediationProgram HistoryCurrent configuration of the bureau was formed in response to the passage of the federal Comprehensive Environmental Response, Compensation and Liability Act (Superfund).
Consequences of Not Funding this ProgramContaminated sites or permitted facilities will have or potentially have uncontrolled release of petroleum or hazardous chemicals causing harm to human health and the environment. Increase of human exposure to hazardous materials, petroleum substances and other toxic materials. More involvement of the US Environmental Protection Agency in Kansas. Program GoalsA. Promote redevelopment of contaminated properties to allow beneficial use of dilapidated or impacted properties. B. Maximize pollution prevention measures to prevent release of stored chemicals. C. Improve environmental health conditions for Kansans through contaminated site assessment, response and cleanup. Performance Measures
Bureau of Waste ManagementProgram HistoryThe KDHE is the only state agency to implement the solid and hazardous waste programs authorized by the statutes referenced above. The Kansas Solid Waste Management Act was adopted in 1970. Key revisions occurred when KDHE sought approval from the United States Environmental Protection Agency to administer federal solid waste rules promulgated under the Resource Conservation and Recovery Act (RCRA) in 1993,1996 and 2009. The Solid Waste Program regulates solid waste disposal areas and processing facilities and waste tire handling; offers compliance assistance to regulated entities, and; provides financial support and grants to local entities. The Hazardous Waste Management Act was adopted in 1981. Key revisions occurred when KDHE sought approval to administer federal rules in 1985 and 2013. Under the hazardous waste program KDHE regulates generators of hazarous waste and permits facilities that treat, store and/or dispose hazardous waste to ensure proper cradle-to-grave management.
Consequences of Not Funding this ProgramThe Bureau of Waste Management implements all regulations for solid waste disposal areas and processing facilities, waste tire management, hazardous waste generators and transporters, and hazardous waste treatment, storage and disposal facilities in Kansas. Failure to fund the program would result in no regulatory oversight of solid and hazardous waste management activities in Kansas causing public health and environmental impacts including: illegal dumping; surface and groundwater contamination, and; public safety and nuisance conditions like fires, odors, litter and disease vectors. EPA would implement the hazardous waste programs in Kansas, and KDHE would forfeit about $1.1 million annually in federal hazardous waste program funding. Program GoalsA. Review active and closed solid waste landfill groundwater monitoring reports in a timely manner in order to coordinate response actions at landfills where off-site groundwater contamination is detected above the regulatory limit. B. Maintain a compliance rate of 90% or higher among permitted solid waste facilities and hazardous waste generators by conducting routine inspections and providing compliance assistance and operator training. C. Oversee the regulation of all hazardous and solid waste facilities in Kansas in accordance with the authorizing statutes. The unit cost was estimated by dividing the total number of facilities subject to regulations by the total program funding budgeted for each state fiscal year. Performance Measures
Bureau of WaterProgram HistoryThe origins of the Bureau of Water began in 1885 when the first rules and regulations pertaining to protecting water supplies were adopted by the Ks Board of Health (now KDHE). In 1907, the first statute prohibiting unpermitted sewage from entering waters of the state was approved and in 1927 the Kansas Board of Health was charged with preventing pollution found to be a public health or aquatic life threat. In 1933, the Legislature established laws pertaining to pollution prevention from livestock facilities. In 1972 the Federal Water Pollution Control Act was passed by Congress and in 1974 Congress approved the Safe Drinking Water Act. The Kansas Legislature responded in 1974 by creating the Kansas Department of Health and Environment as a cabinet-level agency to implement the two Federal laws as well as the accompanying state statutes.
Consequences of Not Funding this ProgramImplementation of the Safe Drinking Water Act would revert to the Environmental Protection Agency. KDHE's technical assistance and training would be eliminated. Kansas would lose $1.1m annually through the Public Water Supply Supervision Grant, and would lose $8.3-$16.6m annually from the Capitalization Grant which supports the Drinking Water State Revolving Fund. Public health and the environment could be jeopardized by improperly operated and maintained water supply and water pollution facilities. Implementation of the Clean Water Act would also return to the Environmental Protection Agency, including enforcement which would be a burden on our towns and industry . Most wastewater systems would suffer from lack of training and technical assistance. Approximately six millions dollars annually of federal funding would be lost. Program elimination also eliminates the state's ability to protect water supplies for municipalities, industries, livestock and irrigation and reduce pollutant loadings crossing statelines. Program GoalsA. Monitor water quality of Kansas waters to assist in development of water quality standards and total maximum daily loads (TMDLs) and to track environmental changes for water quality improvement. B. Provide subsidized financing (low interest loans) for municipal water infrastructure projects through the Kansas State Revolving Fund Programs to return and maintain municipal water and wastewater systems into compliance. C. Oversight of public water supply systems, wastewater and stormwater facilities, underground injection control (UIC) wells, and underground hydrocarbon storage (UHS) wells with regards to standards, regulations, and technical assistance (979 public water supply systems, 1853 wastewater facilities, and 3404 stormwater facilities, 73 UIC wells, and 368 UHS wells for a total of 6,677). Performance Measures
Environmental Field ServicesProgram HistoryIn SFY 2018, the program was re-aligned to include the Livestock Waste Section and the Watershed Management Section, which allows field based programs to better work together. Total budget for this program includes significant amount of funding (state and federal) that is passed through as aid to locals.
Consequences of Not Funding this ProgramImplementation of all environmental programs would revert to the Environmental Protection Agency and funds for aid to locals would be curtailed. Program GoalsA. Conduct compliance inspections/complaint investigations/spill responses. B. Issue permits for confined animal feeding operations. C. Reduce non-point source pollution. Performance Measures
Office of Laboratory Services (Kansas Health and Environment Laboratories)Program HistoryHistory: The first biological and chemical analyses for Public Health and Protection were performed in 1886 at the Kansas Board of Health. In 1907, the Environmental Microbiology laboratory began analyzing water and wastewater for public health as a part of the Division of Sanitation. This was the first lab that would become what is now Kansas Health and Environmental Laboratories (KHEL). When the Kansas Department of Health and Environment was established by legislative action in 1974, the combined health and environmental laboratory was located in the Forbes Field complex. Named in statutes as the Office of Laboratory Services, the Division of Health and Environmental Laboratories became part of the Division of Environment in FY 2007. The total funding shown for the program in FY 2020 through FY 2023 represents COVID funding to support not only the laboratory operations but many supplies and equipment provided to partners throughout the state to fight the COVID 19 Pandemic.
Consequences of Not Funding this ProgramInfants could go undiagnosed and experience permanent or life threatening disorders. The public would have greater exposure to viruses and diseases. Outbreaks could go undetected due to no investigative testing capacity. Increase risk and cost to Kansans due to poor water quality and decreased monitoring. Public Water Suppliers would have to find outside laboratories to perform testing and Kansas would have to contract with and designate a Primacy Laboratory or else have the program taken over by EPA. EPA would take over drinking water program, Clinical Testing Labs would not be evaluated for accurate performance, intoxicated drivers would remain on the highways. Program GoalsA. Conduct clinical and environmental testing with a high degree of accuracy as measured by performance on proficiency tests. B. Maintain staff flexibility and continuity of operations by ensure that staff are cross trained in multiple methods and that each method has multiple staff that can perform it. C. Process samples for both Clinical and Environmental purposes as measured by number of samples and average price per test. Noting that much of the budget provided in 2020,-2023 includes significant budgets that included pass through equipment, supplies and testing costs. Kansas State FairAdministrationProgram HistoryIn 1913, the Kansas Legislature declared the "Official" Kansas State Fair be located on 112 acres in Hutchinson that was donated by the citizens of Reno County and was authorized by KSA #2 201 through 2-205. KSA #74 520 through 74 525 designated the Kansas State Fair Board as the responsible body to organize and present the annual State Fair. These funds take care of the day to day operations of the Fair to include but not limited to staffing, office equipment, marketing and the like.
Consequences of Not Funding this ProgramThe Kansas State Fair is a Fee Funded organization that is reliant on dollars brought in to afford the programs that it supplies to the citizens of the State of Kansas. If these programs are not funded, there would be no way that we would be able to have a State Fair. Program GoalsA. Support the Mission of the Kansas State Fair - To promote and showcase Kansas agriculture, industry, and culture; to create opportunity for commercial activity; and to provide an educational and entertaining experience that is the pride of all Kansans. B. To enhance the professional development and retention within the Kansas State Fair Team. C. Increase in efficiency and effectiveness of State Fair program implementation and administration. Performance Measures
Capital ImprovementsProgram HistoryIn 1913, the Kansas Legislature declared the "Official" Kansas State Fair be located on 112 acres in Hutchinson that was donated by the citizens of Reno County and was authorized by KSA #2 201 through 2-205. KSA #74 520 through 74 525 designated the Kansas State Fair Board as the responsible body to organize and present the annual State Fair. These funds take care of the day to day operations of the Fair to include but not limited to staffing, office equipment, marketing and the like.
Consequences of Not Funding this ProgramThe Kansas State Fair is a Fee Funded organization that is reliant on dollars brought in to afford the programs that it supplies to the citizens of the State of Kansas. If these programs are not funded, there would be no way that we would be able to have a State Fair. Program GoalsA. To provide the Kansas State Fairgrounds, which encompasses approximately 280 acres with 75 buildings and nearly 24 acres under roof, as a safe and secure facility for all Kansans and guests to the State. B. To ensure the safety and security to all patrons on the Kansas State Fair through continual improvements to facilities and grounds. Performance Measures
FacilitiesProgram HistoryIn 1913, the Kansas Legislature declared the "Official" Kansas State Fair be located on 112 acres in Hutchinson that was donated by the citizens of Reno County and was authorized by KSA #2 201 through 2-205. KSA #74 520 through 74 525 designated the Kansas State Fair Board as the responsible body to organize and present the annual State Fair. These funds take care of the day to day operations of the Fair to include but not limited to staffing, office equipment, marketing and the like.
Consequences of Not Funding this ProgramThe Kansas State Fair is a Fee Funded organization that is reliant on dollars brought in to afford the programs that it supplies to the citizens of the State of Kansas. If these programs are not funded, there would be no way that we would be able to have a State Fair. Program GoalsA. To provide the Kansas State Fairgrounds, which encompasses approximately 280 acres with 75 buildings and nearly 24 acres under roof, as a safe and secure facility for all Kansans and guests to the State. B. The State Fair is the state's largest single event and typically attracts more than 300,000 people annually, plus an estimated 200,000 people to the more than 600 non-fair events held throughout the year. Performance Measures
Kansas Water OfficePublic Water Supply ProgramProgram HistoryThe Kansas Water Office (KWO) operates the Kansas Water Marketing, Water Assurance and Access District programs as part of its overall Public Water Supply (PWS) Program. KWO has developed the Public Water Supply Program Comprehensive Capital Development Plan (CCDP) in order to account for all revenue and expenses related to the State's public water supply storage, and to provide for the long?term planning of future program needs, including acquisition of all the water supply storage under federal contracts, potential new storage development and protection and restoration of the storage owned by the State. Various funding sources contribute to KWO's overall PWS Program and are represented as part of the CCDP. These funding sources are the Water Marketing Fund, Water Assurance Fund, and Access District Fund.
Consequences of Not Funding this ProgramThe ability to meet water supply demands of all customers of the PWS programs in accordance with existing long-term contracts and operations agreements, ensuring that the state continues to meet its current and future obligations associated with state-owned water supply storage, and continued operations and analysis to effectively protect, maintain, and secure state-owned storage to support the needs of the citizens of Kansas will be limited. Program GoalsA. Ensure that the water supply needs of the citizens of Kansas are met in an economical and efficient manner. B. Ensure that municipal, industrial and irrigation water rights on the major rivers have an adequate water supply during drought conditions. C. Effectively utilize storage to lengthen support during low flow conditions. Performance Measures
Water Planning and ImplementationProgram HistoryThe Water Planning and Implementation program covers the major agency responsibility for the development and coordination of implementation efforts of the Kansas Water Plan. These development and coordination of implementation efforts provide a collaborative framework to extend the life of the Ogallala-High Plains Aquifer; secure, protect and restore Kansas reservoir water supply; improve our state's water quality; reduce our state's vulnerability to extreme events (including flood and drought); as well as increase overall awareness of Kansas water resources. The administration of the Kansas Water Planning Act, Kansas Weather Modification Act, and portions of the Water Appropriations and Water Transfer acts are housed in this program. This program also houses the Kansas Water Authority, which is statutorily within the Kansas Water Office. The Authority is responsible for advising the Governor, Legislature, and the Director of the Kansas Water Office on water policy issues; approving the Kansas Water Plan; accounting for and making recommendations on the expenditures of State Water Plan Funds; and approving water storage sales, water marketing rate setting, federal contracts, administrative regulations, and legislation proposed by the Kansas Water Office. The Authority is composed of 24 members (13 voting, 11 ex-officio) that represent stakeholder groups and are informed of water-related issues representing water users, water interests, environmental interests, and the general public.
Consequences of Not Funding this ProgramWithout KWO water planning and implementation efforts, Kansas will not be able to plan and meet current and future water supply demands now for the Ogallala Aquifer region as well as from areas served by reservoir water supply storage. Kansas would also not be able to fully coordinate on planning and implementation activities to address water quantity and quality issues impacting Kansas as identified in the Kansas Water Plan. At the current rate, with no changes during Vision implementation, the Ogallala Aquifer will be 70 percent depleted and our reservoirs will be 40 percent filled with sediment within the next 45 years. Program GoalsA. Develop and propose water policies that are long-term in scope. B. Identify and address priority water resource issues in Kansas. C. Support the Kansas Water Authority in its role of making policy recommendations to the Governor and Legislature. D. Measure the condition of the water resources of the state. E. Provide adequate technical analysis and background to support the development of policy and priority issues. F. Measure and assess the status and effectiveness of practices and projects implemented through the State Water Plan. G. Be an active participant in water resources policy formation and recommendations that result in legislation. H. Foster a trust in the planning process which is conducted in an open public forum and based on sound research. I. Involve the public and stakeholders in the development of proposed policy initiatives. J. Create electronic and written publications in a format and style that the public finds accessible. K. Annually host a Governor's Conference on the Future of Water in Kansas to disseminate information and encourage public engagement in water issues. Performance Measures
EDUCATIONEDUCATIONBoard of RegentsAdministrationProgram HistoryIn addition to staff support for the Board of Regents and Technical Education Authority, this program provides office administration of academic programs, career technical education, regulation of private and out-of-state institutions, student financial aid, federal programs, data and planning, facilities planning, and financing/funding of the state's 32 public colleges and universities. The most recent change to the Board office administration occurred with the passage of SB 345 in 1999, creating the Kansas Higher Education Coordination Act (KSA 74-3201a), bringing all public higher education institutions under the supervision of the Board.
Consequences of Not Funding this ProgramDecreased higher education coordination; inability to collect and analyze data; decreased higher education strategic vision for Kansas. Program GoalsA. Provide effective and efficient staff support to the Board of Regents, Technical Education Authority, and the postsecondary education institutions they govern and coordinate. Performance Measures
Postsecondary Education InstitutionsProgram HistoryThis program comprises various appropriations and funding sources for the state's 32 public postsecondary institutions, including state universities, Washburn University, community colleges and technical colleges. The program was most significantly impacted with the passage of the Higher Education Coordination Act (KSA 74-3201a).
Consequences of Not Funding this ProgramKansas public postsecondary education institutions would not have the available state funds to meet goals of educating Kansans. The cost of attending a Kansas public postsecondary education institution would increase for families, which could decrease the number of citizens earning credentials to meet workforce demands across the state. Funding for the program also has a direct impact on the Board's Strategic Plan: Building a Future and the ability to reach the goals within the plan. Program GoalsA. Helping Kansas Families: aims to ensure that higher education remains affordable and accessible to Kansans, while continuing to help graduates achieve success. B. Supporting Kansas Businesses: focuses on the advantages higher education can provide to Kansas businesses in the development of a talent pipeline. Performance Measures
Student Financial AssistanceProgram HistoryThis program includes all state sponsored student financial assistance programs available to Kansas residents attending both public and independent higher education institutions. It has developed and changed over the years as new scholarship programs are created and revised.
Consequences of Not Funding this ProgramDecreased funding available for scholarships and grants awarded to students attending Kansas higher education institutions, which would increase the cost of attendance and decrease the number of students able to afford postsecondary education and attain a credential. Program GoalsA. Award scholarships to students in order to increase affordability of attending postsecondary education. Performance Measures
Department of EducationAdministrationProgram HistoryThis program provides legal, human resource, communication, school finance, accounting, budgeting, purchasing, auditing, information technology, research, and legislative services to the entire agency. Additionally, it oversees the licensing of educators and accreditation of education systems in Kansas. These services have long existed in the Kansas State Department of Education and its predecessor agencies. However, certain services have become more important over time. In particular, information technology services have increased in importance as KSDE collects more data and operates more web-based applications.
Consequences of Not Funding this ProgramIf the Administration program wasn't funded, the ability of KSDE to do the following would either be diminished or eliminated: process/audit state and federal aid payments to school districts; license teachers; accredit school districts; accredit teacher preparation programs; collect data from school districts; respond to requests for information from the Legislature and Governor; follow federal and state regulations for procurement; recruit and hire staff; comply with federal and state employment laws; and communicate to all public and nonpublic schools in Kansas. Program GoalsA. Access and distribute state and federal revenues to local education agencies and other qualifying organizations. B. To verify the fiscal accountability of all USDs, special education interlocals, cooperatives, service centers, child care centers, and non-public entities. C. Ensure Kansas educators are qualified and prepared to improve the learning of Kansas students. D. To ensure that all educational systems in Kansas achieve Kansas Education Systems Accreditation (FY 2018 was the first year of KESA). E. Continue the development and enhancement of web-based applications for seamless communication and exchange of information with customers and funding agencies. F. Utilize federal SLDS grant to maximize standardization of data, increase interoperability of systems and modernize overall P20W SLDS capabilities. Performance Measures
Career and Technical EducationProgram HistoryIn 1917, Congress enacted the Smith-Hughes Act which authorized federal funds for the establishment and support of secondary and postsecondary vacational training in agriculture, home economics, and trade and industry. The 1985 Carl D. Perkins Vocational Education Act aimed to expand, improve, modernize, and develop quality vocational education programs to meet the needs of the workforce and promote economic growth, as well as meet the needs of specific populations, including handicapped and disadvantaged individuals. The Perkins Act was reauthorized in 2018 and now allows school districts to use federal funds to provide all students, not just those enrolled in CTE courses, career exploration and development activities. Since July 1, 2004, the Kansas Board of Regents has served as the lead agency for the Perkins Grant. Funding is split eveningly between KBOR and KSDE.
Consequences of Not Funding this ProgramNot funding the Career and Technical Education program would limit the amount of CTE courses available to students in Kansas middle and high schools, which would make Kansas graduate less prepared to enter a highly technical labor market. Additionally, eliminating or reducing State funding would place federal funding at risk. Program GoalsA. Provide technical assistance and support to local school districts to ensure every middle school and high school student has an Individual Plan of Study in place and is engaged in a quality career pathway leading to success in postsecondary education or in the workforce. Performance Measures
Child Nutrition and WellnessProgram HistoryThe Child Nutrition and Wellness program administers several programs sponsored by the U.S. Department of Agriculture that provide health food to children including the National School Lunch Program, School Breakfast Program, Child and Adult Care Food Program, and several others. The National School Lunch Program was authorized in 1946 and the School Breakfast Program was made permanent in 1975, with other programs following. State law provides for state aid for school lunches, which is a match required under federal law.
Consequences of Not Funding this ProgramFailure to fund the Child Nutrition and Wellness program would be the loss of approximately $200 million in annual federal funding for school nutrition programs. As a result, children who depend on school nutrition programs for meals would no longer have access to free or reduced price meals. Program GoalsA. Sponsors provide participants with nutritious, appealing meals. B. Sponsors comply with federal and state requirements; operate efficient and effective programs; and receive reimbursement for meals and snacks served. C. Sponsors increase participants' awareness of the benefits of choosing nutritious foods. Performance Measures
Financial AidProgram HistoryThe distribution of state aid has always been the responsibility of the Department of Education or its predecessor agencies. The amount of state aid distributed has been significantly impacted by legislative changes and court challenges. Major school finance formulas have included the State Foundation Aid of 1965; School District Equalization Act of 1972; School District Finance and Quality Performance Act of 1992; Classroom Learning Assuring Student Success Act of 2015; and the Kansas School Equity and Enhancement Act of 2017. Signficant court challenges include Mock v. State of Kansas, USD 229 v. State of Kansas, Montoy v. State of Kansas, and Gannon v. State of Kansas. Additionally, KSDE has distributed the vast majority of federal aid to school districts since 1947, which is when the Legislature authorized school districts to participate in the National School Lunch Program. Other major federal aid programs include Title I and special education funding. Performance measures for the Financial Aid program are those identified for KSDE's other programs, excluding those for the Kansas Children's Cabinet. Accurately implementing the Financial Aid program assists these programs in meeting their performance measures.
Consequences of Not Funding this ProgramFailure to fund the Financial Aid program would result in school districts not having the funding to effectively operate and educate Kansas students. Program GoalsA. To provide financial support that will assist local education agencies in meeting the educational needs of students. Governance of EducationProgram HistoryArticle 6 of the Kansas Constitution provides for the Kansas State Board of Education. The State Board consists of 10 elected members, each representing a district comprised of four contiguous senatorial districts. Board members serve four-year terms with an overlapping schedule. Every other year, the State Board reorganizes to elect a chairman and vice-chairman. The State Board appoints a Commissioner of Education who serves as its executive director. The Kansas State Board of Education was created to replace the position of the Kansas State Superintendent of Public Instruction effective January 14, 1969.
Consequences of Not Funding this ProgramThe constitutionally proscribed State Board of Education would not be able to carry out its duties to provide general supervision of the State's K-12 educational interests. Program GoalsA. Kansas leads the world in the success of each student. B. Provide an effective educator in every classroom. C. Develop active communication and partnerships with families, communities, business stakeholders, constituents, and policy partners. Performance Measures
Kansas Children's CabinetProgram HistoryIn 1980, Kansas was the first state to establish a special fund, the Kansas Family and Children Trust Fund, dedicated to the prevention of child abuse and neglect by funding community-based prevention programs. In 1992, the Legislature created the Corporation for Change, which was given the responsibility for administering the Children's Trust Fund. In 1998, the Corporation for Change was replaced by the Governor's Advisory Committee on Children and Families. In 1999, the Governor's Advisory Committee on Children and Families was abolished and the Children's Cabinet was created. The Children's Cabinet was tasked with advising the Governor and Legislature on how best to use the tobacco Master Settlement Agreement moneys credited to the Children's Initiatives Fund and to assist the Governor in developing a coordinated, comprehensive system to serve children and families in Kansas. From its creation through June 30, 2016, the Department of Social and Rehabilitative Services and the Department for Children and Families served as the fiscal agent for the Children's Cabinet. Since July 1, 2016, the Kansas State Department of Education has served as the Cabinet's fiscal agent.
Consequences of Not Funding this ProgramFailure to fund the Kansas Children's Cabinet would result in a reduction or elimination of services to Kansas families and children in a variety of areas, including child abuse and neglect prevention, early childhood education, mental and behavioral health screening, training for parents and health care providers, and access to healthcare. Program GoalsA. The Children's Cabinet will develop and implement a coordinated, comprehensive delivery system to improve the health and well-being of families and children in Kansas and evaluate programs funded with Children's Initiatives Funds. Performance Measures
Special Education ServicesProgram HistoryA special education division was created in the State Department of Public Instruction (the predecessor to KSDE) in 1949. The first appropriations for financing special education classes were made in 1951. In 1975, Congress passed the Education for all Handicapped Children Act (EHA) in order to ensure that all students with disabilities have access to a free and appropriate education. In addition, financial assistance to state was authorized to allow compliance with the new law. Congress has periodically updated and reauthorized the law to improve the structure of supports and accountability. In 1990, the EHA was reauthorized and the title changed to the Individuals with Disabilites Education Act (IDEA). The most recent reauthorization of the IDEA was in 2004. The Kansas Special Education for Exceptional Children Act was passed in 1974. The state law largely mirrors the IDEA, but also includes gifted students and children enrolled in private schools as students eligible to receive a free and appropriate public education. This program also oversees all early childhood education programs administered by KSDE.
Consequences of Not Funding this ProgramFailure to fund the Special Education Services program would diminish the amount of support and assistance KSDE can provide to students in special education programs throughout Kansas. Additionally, failure by the State to provide necessary services opens up the State to legal consequences, including court orders and the loss of federal funding. Program GoalsA. Provide leadership, technical assistance, and financial support to local education agencies to ensure high-quality special education programs and success for all students with disabilities. B. To support local agencies providing early learning opportunities and to collaboratively strengthen early childhood services in Kansas so that each student enters kindergarten at age five socially, emotionally, and academically prepared for success. C. Assist local education agencies in employing highly-qualified teachers, administrators, and support staff. Performance Measures
Standards and AssessmentsProgram HistoryState History: In the 1980s, a state minimum competency law existed that required all schools in Kansas to participate in a minimum competency testing program in reading and mathematics developed by the University of Kansas. Beginning in 1992, the state law has required the State Board of Education to establish curriculum standards for mathematics, science, ready, writing, and social studies and to develop statewide assessments in those core subjects. State assessments must be administered at three grade levels, as determined by the State Board of Education.
Consequences of Not Funding this ProgramFailure to fund the Standards and Assessments program would result in KSDE not being able to develop and implement the state assessments and academic standards required by both state and federal law. Program GoalsA. Provide the resources educators need to ensure that Kansas graduates have the academic and cognitive preparations, technical and employability skills, and civic engagement experiences to be successful in (1) postsecondary education, (2) the attainment of an industry-recognized certification, or (3) the workforce, without the need for remediation. Performance Measures
Title Programs and ServicesProgram HistoryCongress passed the Elementary and Secondary Education Act (ESEA) in 1965 to provide supplemental assistance to local school districts to support the academic success of low-income children (Title I, Part A). Since enactment, the ESEA has been expanded to include a variety of other at-risk students, including English-language learners (Title III, Part A), students in rural areas (Title IV, Part B), migrant students (Title I, Part C), and neglected and delinquent youth (Title I, Part D). Additionally, ESEA provides funds to train and recruit high-quality teachers (Title II, Part A), funds Student Support and Enrichment Grants (Title IV, Part A), and funds 21st Century Community Learning Grants (Title IV, Part B). All of this federal grant funding is expended through KSDE's Financial Aid program, but the grants are administered by the Title Programs and Services program.
Consequences of Not Funding this ProgramReductions or elimination in funding for the Title Programs and Services program would significantly reduce supplemental supports and assistance to Kansas students, including to subgroups Program GoalsA. Provide leadership, technical assistance, and financial support to local education agencies to ensure the success of all at-risk and special population students. Performance Measures
Historical SocietyAdministrationProgram HistoryThe administrative functions have been part of the Kansas Historical Society since it was formed in 1875. In 1990 the agency obtained legislation to operate a third-party rental program for agency facilities.
Consequences of Not Funding this ProgramWithout the Administration program, the Kansas Historical Society programs mandated by statute could not function as the Administration program provides centralized support for all other programs, ensuring the agency uses state resources in a responsible and productive way. Without this program there would be no security, no human resources, no business office, no working physical plant, or IT services. There would be no security or maintenance and preservation of the state's 57 buildings under the care of the agency. Communication to the public would also collapse in terms of the agency's website and public response. The Administration program covers all indirect costs. Program GoalsA. Ensure the agency uses public resources wisely by taking regular public feedback, updating agency priorities annually, and practicing fiscal responsibility. B. Providing management of the agency's buildings and structures, as well as the agency's IT infrastructure. C. Ensure all staff and visitors are safe and that all agency communications are transparent and easily accessed. Performance Measures
ArchivesProgram HistoryFunctions of the State Archives have been part of the Kansas Historical Society since it was founded in 1875. The Land Survey Program and the Law Enforcement Memorial were transferred to the agency in the 1980s. All functions are mandated by statutes.
Consequences of Not Funding this ProgramIf the Administration program is not funded, the agency would not be able to maintain a Director, Chief Fiscal Officer or Director of Human Resources. If these positions and other requisite expenditures were not funded, the agency would not maintain central oversight of all other agency programs. Program GoalsA. Collaborate with Kansas state and local government officials to draft and submit to the State Records Board new and revised records retention and disposition schedules that accurately reflect contemporary government business practices and provide records management training to Kansas state and local government officials. B. Collect, preserve, and make available to the public Kansas state government records with enduring, or permanent, value housed in the State Archives with access provided in-person and/or digitally. C. Process current land survey reference report filings and providing land surveyors with access to historical land survey records housed in the State Archives. Performance Measures
Cultural ResourcesProgram HistoryState and federal laws enacted beginning in the 1960s were established to protect the state's cultural resources. The National Historic Preservation Act of 1966 was amended in 1970 and 1980 and is the basis of some of these program activities. Federal money allocated to Kansas for these activities are matched by the state (60% federal and 40% state). The Heritage Trust Fund (1990) and the Historic Preservation Tax Credits (2001) were established by state statute. The State Historic Sites were acquired by the state between 1899 and 2015, by statute or through budget appropriations.
Consequences of Not Funding this ProgramWithout the Cultural Resources program, there would be no state recognition and protection for historic structures and sites. Several state and federal economic development programs would be discontinued, and the state would no longer financially assist businesses and historic property owners, seriously impacting the economies of communities across Kansas. This could lead to a decline in business districts and neighborhoods in some small towns. There would be no protection of antiquities and unmarked burials in the state as prescribed by state and federal legislation. Since this program acts as a liaison to tribal governments historically affiliated with the state, not funding this program could affect tribal relations. Federal law requires a review of all federally funded activities in the state to ensure that important cultural resources are not lost or at least mitigated. Without this program, many other state and private projects could be shut down or delayed without qualified reviews (i.e., road development, cell tower construction, utility repairs). The state owns 15 State Historic Sites that would not be cared for or open to the public and schools. Program GoalsA. Administer the nomination procedures of the Register of Historic Kansas Places and the National Register of Historic Places and facilitate identification of historic resources in the state, while providing incentives such as state and federal tax credits and Heritage Trust Fund grants for the rehabilitation of such properties. B. Meet all state and federal requirements in evaluating potential effects on the state's historic and cultural resources, providing mitigation opportunities when necessary, and cooperating with tribal, city, and county governments. C. Preserve and operate the state-owned historic sites, opening to the public at least six months of the year. Performance Measures
EducationProgram HistoryThe functions of the Education program have been part of the Kansas Historical Society since it was formed in 1875. The state history museum began originally in the Capitol and in 1914 moved to the Memorial Building. The current Kansas Museum of History opened its doors to the public in 1984. In 1988 when the state began requiring a course in Kansas history and government for all students there was an outcry from the schools asking for curriculum materials to satisfy this requirement. With the knowledge and support of the State Department of Education, the Kansas Historical Society agreed to take on this role. Kansas history, government, economics, and geography are included in state curricular standards.
Consequences of Not Funding this ProgramIf the Administration program is not funded, the agency would not be able to maintain a Director, Chief Fiscal Officer or Director of Human Resources. If these positions and other requisite expenditures are not funded, the agency would not maintain central oversight of all other agency programs. Program GoalsA. Ensure excellence in teaching by producing curriculum materials that explores the stories of Kansas, while educating students on research skills that are practical and applicable to everyday life. B. Provide information to the public at the Capitol Visitor Center and interpret Kansas government to K-12 students and the public through tours, programs, and exhibits, emphasizing civic engagement. C. Operate the Kansas Museum of History to tell the stories of Kansas by maintaining exhibits based on the state's artifact collections and developing specialized school tours aligned to state curriculum standards. Performance Measures
School for the BlindAdministrationProgram HistoryKSSB was established in 1867 and is a trusted source of information and expertise related to vision services for school districts and blind students across the state. The administration provides leadership to ensure that the agency's resources are aligned with its vision and goals.
Consequences of Not Funding this ProgramInability to maintain services to students, violation of Free Appropriate Public Education (FAPE) and Individuals with Disabilities Education Act (IDEA). Program GoalsA. Increase school enrollment. B. Improve school climate. C. Improve operational efficiencies and maximize resources allocated to student services. Performance Measures
Instructional ServicesProgram HistoryKSSB promotes equal access for all children who are blind, low vision or deaf-blind in Kansas' schools. The campus program serves elementary through high school and transition students. Field Services works with local districts to maximize resources and personnel to serve students with qualified staff throughout the state.
Consequences of Not Funding this ProgramStudent Individual Education Plan (IEP) services disrupted, violation of Individuals with Disabilities Education Act (IDEA). Program GoalsA. Increase outreach services to infants and young children who are Blind/VI across Kansas. B. Increase students 0-21 who are Blind/VI across Kansas receiving direct instructional contact from KSSB. Performance Measures
Support ServicesProgram HistoryFocus of Support Services is to make sure students have safe and secure facilities for delivery of high-quality educational services. In 2012 the closure commission recommended combining Administration/Support Services with KSSD to achieve efficiencies. All departments within Support Services share supervisory employees with KSSD. Additional staff members provide support on either campus as needed to further promote savings.
Consequences of Not Funding this ProgramStudent Individual Education Plan (IEP) services disrupted, violation of Individuals with Disabilities Education Act (IDEA). Program GoalsA. Safe and secure environment for students and professionals that provide specialized education. B. Provide and support technology on campus for specialized educational needs of students. C. Maintain safe vehicle fleet to transport students to off-campus academic classes, extracurricular activities. Performance Measures
School for the DeafAdministrationProgram HistoryKSSD is an accredited school established in 1861 and committed to educating Deaf/Hard of Hearing students. It serves as a center-based educational option to provide a free and appropriate education in the least restrictive environment (most accessible). KSSD also has an Outreach department to serve as a statewide resource center for families and students served in their local school districts.
Consequences of Not Funding this ProgramInability to maintain services to students, violation of Free Appropriate Public Education (FAPE) and violation of Individuals with Disabilities Education Act (IDEA) Program GoalsA. Advance agency's mission, vision and core values by assuring quality services are provided to internal and external community members. B. Promote safe, healthy environment for employees to gain satisfaction from their contributions to agency mission. Performance Measures
Instructional ServicesProgram HistoryInstructional Services operates both a campus-centered program and outreach services which serve children aged birth through 21 years old. It includes a Student Life program for those who live too far from KSSD to attend as a day student. Student Life includes language immersion, social emotional development, homework and tutoring support and access to extracurricular activities.
Consequences of Not Funding this ProgramStudent Individual Education Plan (IEP) services disrupted, violation of Individuals with Disabilities Education Act, (IDEA). Program GoalsA. Increase student enrollment at campus-based program. B. Increase direct and indirect support for students and families. C. Administer language assessment assessments to at least 50 students each year through LAP. Performance Measures
Support ServicesProgram HistoryFocus of Support Services is to make sure students have safe and secure facilities for delivery of high-quality educational services. In 2012 the closure commission recommended combining Administration/Support Services with KSSB to achieve efficiencies. All departments within Support Services share supervisory employees with KSSB. Additional staff members provide support on either campus as needed to further promote savings.
Consequences of Not Funding this ProgramStudent Individual Education Plan (IEP) services disrupted, violation of Individuals with Disabilities Education Act, (IDEA). Program GoalsA. Safe and secure environment for students and professionals that provide specialized education. B. Provide and support technology on campus for specialized educational needs of students. C. Maintain safe vehicle fleet to transport students to off-campus academic classes, extracurricular activities. Performance Measures
State LibraryReference DivisionProgram HistoryThe Reference Division is composed of a reference program that provides direct assistance to inquiries from and about all branches of Kansas government. The other program within the Reference division is state documents and cataloging. This program organizes information produced by Kansas government to assist current and future research needs regarding Kansas government. The Organic Act of 1855 specified a library "to be kept at the seat of government for the use of the governor, legislative assembly, judges of the supreme court, secretary, marshal, and attorney of said territory ..." Organic Act: An Act to Organize the Territory of Kansas (1855) Sec. 33. This requirement is still the goal of the Reference Division at the State Library but utilizing modern resources. L. 1862 ch. 187, Sec. 35 through 41 provided for the management of the State Library, requiring a catalog and books to be loaned and returned. L. 1883, ch. 26 appropriated funds "for page and messenger in the state library during legislative session." L.1909, ch. 16, Sec. 19 required the State Library to "establish and maintain a legislative reference department of such [state] library". From about 1909 until 1929 legislative reference work and bill drafting were performed by a member of the State Library staff known as the "Legislative Reference Clerk." The Legislative Reference Department was moved to the Revisor of Statutes when that office was created in 1929. Library staff still performed research and worked "in close cooperation with the Revisor of Statutes in accumulating and filing for quick reference material on legislation." Book of the States, 1935, Chapter III. L. 1963, ch. 422 created the State Library as it is now. That law provided for "library and informational services to the judicial, legislative and executive branches..." L. 1971, ch. 184, Sec. 12 provided "one of the functions of the state library shall be to provide legislative reference services." Sec. 34 required the state librarian to employ personnel "to perform legislative reference services and functions." January 14, 1974, the Legislative Hotline began at the State Library, taking messages for legislators, giving hearing dates and times, and status of bills. This service was added at the request of the legislature. L. 1976, ch. 358 established a publication collection and depository system that would avoid costly duplication of library materials and facilitate easy retrieval of state documents. This was the result of an interim study to the 1971 legislature (Prop. No. 39). In 2008 library staff began using instant messaging to answer legislative reference questions.
Consequences of Not Funding this ProgramIf the Reference Division was not funded, Legislative constituents would not be able to ask an accurate and trusted source for information about legislation, legislative procedure, or who their legislators are and how to contact them. One-of-a-kind documents produced by state agencies would be unaccessible to Kansas taxpayers and decision makers and and most likely lost for future use. Program GoalsA. Provide library resources and research support to members of the Kansas Legislature and state agencies. B. Assisting Kansans in identifying legislation and understanding legislative procedure. C. Preserve and provide access to the publications of state government. Performance Measures
Statewide ServicesProgram HistoryThis program carries out the statutory and mission-based obligation to enhance and expand the quality of library service across the state, for all potential library users, and through both direct-to-user services and materials/services shared with local libraries.
Consequences of Not Funding this ProgramIf the Statewide Services program was not funded, more than 400,000 books in digital format become unavailable or inaccessible. Library circulation statewide decreases by nearly over 715,000 transactions. Teachers, students, instructors, parents, researchers, business and industry, along with the general public would lose access to resources searched over 135 million times in FY 2022. Most local libraries would be unable to provide a fraction of the lost information due to the much lower price of statewide purchase (cost avoidance estimate $83,515,399). Additionally, Kansans would be severely limited in their access to library materials other than those held locally. 733,000 requests to borrow titles from cooperating libraries would go unfilled. Timely delivery of materials would suffer should the library courier service not be maintained at current levels. Program GoalsA. Make reading materials available to all Kansans. B. Provide reliable and relevant e-content. Performance Measures
Talking BooksProgram HistoryKansas Talking Books (KTB) provides personalized library support and materials in an accessible format to eligible Kansas residents to ensure that all may read. This library service features audio books, audio magazines, braille books, braille magazines, and playback equipment mailed directly to patrons and returned postage free. The division staff also provide personalized reference and reader advisory support. Patrons have access to the NLS Braille and Audio Reading Download (BARD) service through the web or via mobile app at no-cost. Starting in 1940, the State Department of Social Welfare Division of Services for the Blind contracted braille and talking book services for eligible Kansans through the Wolfner Library in Missouri. The Funding for Talking Books as a divsion of the State Library of Kansas was approved in the Govenor's Budget for FY 1970. KTB was established as a regional network library of the Library of Congress's National Library Service for the Blind and Print Disabled in July 1970. Subregional libraries were established in Manhattan, Hays, Hutchinson, Dodge City, Kansas City, & Wichita, providing direct service to Talking Book patrons in their service areas with administrative and material support provided by the regional library in Topeka. Over the years, subregionals were also located in Great Bend, Topeka, & Norton. The regional library moved from Topeka to Emporia in July 1983. In 2009, Kansas Talking Books began circulating materials on digital talking book cartridges with digital talking book machines to replace the cassette collection. By 2012, all subregional libraries were closed and statewide circulation operations were consolidated to the regional library in Emporia. Contracts for outreach services with NWKLS, SWKLS, CKLS, and SEKLS were establish and remain in place. In 2020, KTB began shifiting to a Download on Demand circulation model, providing access to every title in the NLS collection to patrons on demand.
Consequences of Not Funding this ProgramIf the Talking Books program wasn't funded, Kansans with print disabilities (blindness, visual impairment, physical impairment, reading disabilities) would lose access to an accessible library of over 120,000 audio and braille materials that support lifelong learning, cultural engagement, and entertainment. Program GoalsA. Provide reading materials in an accessible format to eligible Kansas residents. B. Provides personalized library support to eligible Kansas residents. C. Produce specialized reading material by Kansas authors or about Kansas for users of the Talking Books Program. Performance Measures
GENERAL GOVERNMENTGENERAL GOVERNMENTAbstracters Board of ExaminersAdministrationProgram HistoryThe Abstracters' Board of Examiners was created by the 1941 Legislature (KSA 74-3901 et seq.) to administer the Kansas Abstracters' Act (KSA 58-2801 et seq.). The Act provides for regulation of individuals and firms that compile and sell abstracts of Kansas real estate.
Consequences of Not Funding this ProgramConsequences of not funding this program would be that there would be no regulation of or licensing of abstracters in Kansas, nor examinations for abstracters in Kansas. Program GoalsA. To continue to keep the active businesses licensed. B. To promote getting new individuals licensed as Abstracters in Kansas. C. To improve awareness of the value of an Abstract. Performance Measures
Attorney GeneralAdministrationProgram HistoryThe Administration Division provides communications and day-to-day office management of the agency.
Consequences of Not Funding this ProgramThe office management functions of the Kansas Attorney General's office would not take place. Program GoalsA. To provide timely and accurate information to the Legislature and the public on legal matters affecting the state, and to provide for the effective servicing of citizen advisory groups. Kan. Const., art. 1, § 1. Objective #1: To inform and educate the electronic and print news media about the Office of the Kansas Attorney General, the actions and activities of the Attorney General as they relate to matters of public interest, and laws of the State of Kansas. B. To provide timely and accurate information to the Legislature and the public on legal matters affecting the state, and to provide for the effective servicing of citizen advisory groups. Kan. Const., art. 1, § 1. Objective #2: Discuss and prepare, in a timely manner, accurate information for testimony to or for meetings with the Kansas Legislature. Performance Measures
Administration: FiscalProgram HistoryFiscal provides budgetary and financial support for the agency.
Consequences of Not Funding this ProgramThe agency would need to rely on Department of Administration resources to accomplish these day-to-day tasks. Program GoalsA. To provide skilled and comprehensive administrative support to the Office of the Kansas Attorney General. KSA 75-709, 75710, 75311175 -3717, 75-3729, 75-3736; 75-4701 et seq.; 75-5501 et seq.; and amendments thereto. B. Prepare and present the annual budget and support it before the Division of Budget, Governor and Legislature. Monitor administration of the approved budget. C. Provide timely, detailed, and accurate fiscal services in accordance with the budget plan. D. Acquire necessary goods and services, including adequate office facilities and motor vehicles of appropriate quality and quantity, within established funding, in a timely manner and at competitive prices. Purchases are made in accordance with state purchasing guidelines and contracts. Performance Measures
Administration: Human ResourcesProgram HistoryHuman Resources supports the staff of the agency.
Consequences of Not Funding this ProgramThe agency would need to rely on Department of Administration resources to accomplish these day-to-day tasks. Program GoalsA. To provide skilled and comprehensive administrative support to the Office of the Kansas Attorney General. KSA 75-709, 75710, 75311175 -3717, 75-3729, 75-3736; 75-4701 et seq.; 75-5501 et seq.; and amendments thereto. Objective #2: To ensure that the Office of the Kansas Attorney General is staffed with competent and qualified employees, to maintain a quality work environment for those employees and to ensure that federal and state employment laws are adhered to concerning the hiring, firing, discipline, and treatment of employees who work in the Office of the Kansas Attorney General. Performance Measures
Administration: Kansas Intelligence Fusion CenterProgram HistoryThe Kansas Intelligence Fusion Center (KIFC) was established with legislative authority through the appropriations process and by executive action of the governor, the adjutant general and the attorney general. The KIFC put in place careful provisions to ensure the protection of civil liberties and has continued to work closely with appropriate federal agencies to break down silos and ensure that information related to threats to our homeland receives the appropriate analysis. The Kansas approach to operating its fusion center has been noticed nationally as a model that ensures effectiveness in intelligence sharing while ensuring that the focus remains on homeland security issues and protecting civil liberties.
Consequences of Not Funding this ProgramThe risk to Kansas posed by these threats will be undetermined if Kansas is left to depend on increasingly insufficient federal efforts that are not focused on Kansas Security concerns. Adequate threat and risk analysis will not be performed by federal agencies in support of Kansas security efforts leaving the state unaware of threats, with an understanding of the veracity of perceived threats and with no intelligence support to develop defensive/mitigation strategies. Law enforcement and HLS entities in Kansas will be left without vetting and dissemination of national level threat reporting, and no capacity to support effective access to classified threat reporting by cleared leadership. Threats will go undetected by increasingly insufficient federal efforts that are increasingly overwhelmed and cannot build the local, state and infrastructure relationships necessary to identify local threat activity in Kansas. Threats will go undetected by increasingly insufficient federal efforts that are increasingly overwhelmed and excessively bureaucratic and simply not focused on Kansas Security concerns. Program GoalsA. The Kansas Intelligence Fusion Center Act (KSA 48-3701 et seq.) establishes the Kansas Intelligence Fusion Center as part of the Adjutant General's department. The attorney general is tasked with chairing and providing administrative support of the Kansas Intelligence Fusion Center Oversight Board as well as assigning an attorney to serve as privacy and civil liberties counsel to the Center and appointing a Deputy Director for law enforcement. Objective #1: To support the work of the Kansas Intelligence Fusion Center through providing appropriate oversight, legal counsel and liaison with the law enforcement community. Civil DivisionProgram HistoryThe Civil Litigation Division is primarily responsible for providing for the defense of the State of Kansas and its agencies and employees in civil matters contested before Kansas or Federal courts and before administrative agencies. The Division is responsible for carrying out the Attorney General's administration of the Kansas Tort Claims Fund and for providing or arranging for the defense of civil actions or proceedings against covered persons and entities. The Division also acts as Litigation Counsel for numerous, smaller state agencies in disciplinary and licensure matters under the Kansas Administrative Procedures Act or the Kansas Judicial Review Act.
Consequences of Not Funding this ProgramIf the civil litigation division did not represent the state in these legal matters, outside counsel would have to retained in every legal matter. This would result in significant additional cost to the state. The division handles a large number of cases covering a wide range of legal issues. Program GoalsA. To provide efficient, effective and ethical legal advocacy on behalf of the State of Kansas, its agencies and employees, in civil matters contested before a Kansas or Federal court or administrative agency. Memorial Hospital Ass'n, Inc. v. Knutson, 239 Kan. 663, 667, 772 P.2d 1093 (1986); KSA 75-702, -703, -708 -713; KSA 75-6108 & -6117, and amendments thereto; and numerous other statutes found within the Kansas Statutes Annotated and the United States Code. Objective #1: In the defense of the State and/or its agencies and employees, ensure that each and every action or threatened action is responded to in a timely manner. B. To provide efficient, effective and ethical legal advocacy on behalf of the State of Kansas, its agencies and employees, in civil matters contested before a Kansas or Federal court or administrative agency. Memorial Hospital Ass'n, Inc. v. Knutson, 239 Kan. 663, 667, 772 P.2d 1093 (1986); KSA 75-702, -703, -708 -713; KSA 75-6108 & -6117, and amendments thereto; and numerous other statutes found within the Kansas Statutes Annotated and the United States Code. Objective #2: As to cases initiated by, retained or referred to the Civil Litigation Division for action at the trial court level, ensure that each and every action is a pursuit for justice. C. To provide efficient, effective and ethical legal advocacy on behalf of the State of Kansas, its agencies and employees, in civil matters contested before a Kansas or Federal court or administrative agency. Memorial Hospital Ass'n, Inc. v. Knutson, 239 Kan. 663, 667, 772 P.2d 1093 (1986); KSA 75-702, -703, -708 -713; KSA 75-6108 & -6117, and amendments thereto; and numerous other statutes found within the Kansas Statutes Annotated and the United States Code. Objective #3: As to cases initiated by, retained, or referred to the Civil Litigation Division for action at the appellate court level, ensure that each and every action is a pursuit for justice. D. To provide efficient, effective and ethical legal advocacy on behalf of the State of Kansas, its agencies and employees, in civil matters contested before a Kansas or Federal court or administrative agency. Memorial Hospital Ass'n, Inc. v. Knutson, 239 Kan. 663, 667, 772 P.2d 1093 (1986); KSA 75-702, -703, -708 -713; KSA 75-6108 & -6117, and amendments thereto; and numerous other statutes found within the Kansas Statutes Annotated and the United States Code. Objective #4: Prosecute violations of Kansas administrative law on behalf of Kansas licensing boards and agencies. E. To provide efficient, effective and ethical legal advocacy on behalf of the State of Kansas, its agencies and employees, in civil matters contested before a Kansas or Federal court or administrative agency. Memorial Hospital Ass'n, Inc. v. Knutson, 239 Kan. 663, 667, 772 P.2d 1093 (1986); KSA 75-702, -703, -708 -713; KSA 75-6108 & -6117, and amendments thereto; and numerous other statutes found within the Kansas Statutes Annotated and the United States Code. Objective # 5: To provide efficient, effective and ethical legal advocacy on behalf of the State of Kansas in matters relating to the approval of trustee accountings for charitable trusts and protection of charitable assets and beneficiaries. Troutman v. DeBoissiere, 66 Kan. 1, 9, 71 Pac. 286 (1903); K.S.A 58a-110. F. To provide efficient, effective and ethical legal advocacy on behalf of the State of Kansas, its agencies and employees, in civil matters contested before a Kansas or Federal court or administrative agency. Memorial Hospital Ass'n, Inc. v. Knutson, 239 Kan. 663, 667, 772 P.2d 1093 (1986); KSA 75-702, -703, -708 -713; KSA 75-6108 & -6117, and amendments thereto; and numerous other statutes found within the Kansas Statutes Annotated and the United States Code. Objective #6: With regard to bankruptcy litigation, the Civil Litigation Division gives legal advice and assistance to state agencies, including Regents Institutions, involved in bankruptcy litigation and protects against the discharge of student loans, fines, penalties, criminal restitution and other types of debts owed to state government. G. To provide efficient, effective and ethical legal advocacy on behalf of the State of Kansas, its agencies and employees, in civil matters contested before a Kansas or Federal court or administrative agency. Memorial Hospital Ass'n, Inc. v. Knutson, 239 Kan. 663, 667, 772 P.2d 1093 (1986); KSA 75-702, -703, -708 -713; KSA 75-6108 & -6117, and amendments thereto; and numerous other statutes found within the Kansas Statutes Annotated and the United States Code. Objective #7: In matters involving Indian Tribes and the placement of tribal land into trust with the Federal government, the Civil Litigation Division reviews the tribes' applications and, where appropriate, objects to the application before the Bureau of Indian Affairs in the Department of Interior, and, where appropriate, Federal court. H. To provide efficient, effective and ethical legal advice and technical assistance to the Attorney General and agency employees, as well as to any branch, department, agency, authority, institution or other instrumentality of the State of Kansas; other State legal counsel in the performance of their duties, as well as education to the public and profession. Memorial Hospital Ass'n, Inc. v. Knutson, 239 Kan. 663, 667, 772 P.2d 1093 (1986); KSA 75-702, -703, 704, -708, & -710; KSA 75-3111 and numerous other statutes found within the Kansas Statutes Annotated. Objective #1: Respond in a timely manner to questions from State agencies, officials, and employees. I. To provide efficient, effective and ethical legal advice and technical assistance to the Attorney General and agency employees, as well as to any branch, department, agency, authority, institution or other instrumentality of the State of Kansas; other State legal counsel in the performance of their duties, as well as education to the public and profession. Memorial Hospital Ass'n, Inc. v. Knutson, 239 Kan. 663, 667, 772 P.2d 1093 (1986); KSA 75-702, -703, 704, -708, & -710; KSA 75-3111 and numerous other statutes found within the Kansas Statutes Annotated. Objective #2: Help educate the public and the profession about the role of the office and generally applicable legal issues. J. To provide efficient, effective, and ethical legal advocacy on behalf of the State of Kansas in matters concerning 1) the enforcement of the Kansas Funeral and Cemetery Merchandise Agreements, Contracts and Plans Act, Cemetery Merchandise Contracts Act, and the Kansas Cemetery Corporations Act, as those Acts relate to the protection of cemetery trust funds required to be maintained by law; and 2) the investigation of abandoned cemeteries to determine the necessity of the dissolution of the cemetery corporation owning the abandoned cemetery. Objective #1: To receive, process, investigate, and act on matters referred by the Kansas Secretary of State concerning the Kansas Funeral and Cemetery Merchandise Agreements, Contracts and Plans Act, Cemetery Merchandise Contracts Act, and the Kansas Cemetery Corporations Act as those Acts relate to the protection of cemetery trust funds required to be maintained by law, and to effectively, efficiently, and ethically prosecute actionable cases in a timely manner; and to investigate and take action on abandoned cemeteries. Civil Division: Affirmative Civil EnforcementPerformance Measures
Civil Division: Affirmative Civil Enforcement (Forfeiture)Program HistoryThe Equitable Sharing Program is a long-standing partnership with the US Attorney's and the OAG. The assigned AAG is embedded with the US Attorney's office in Wichita.
Consequences of Not Funding this ProgramIf the program were not funded, an income stream that funds expenditure allowed by the Federal Guide for Equitable Sharing for the OAG would be eliminated and and local entities that equitably share in the program would cease to receive their share of the funding as well. Program GoalsA. Through sharing agreements, receive revenues derived from federal forfeiture cases with a state nexus to improve Assistant Attorney General and Appellate Attorney competency, and to build capability to effectively and efficiently present cases to juries through the acquisition and use of quality equipment. Objective #1: Support forfeiture actions against the proceeds and facilitating property of criminal activity. Performance Measures
Civil Division: Affirmative Civil Enforcement (Tobacco Enforcement Unit)Program HistoryThe 2008 Legislature authorized this fund for attorney salaries, operating expenditures and fees for outside counsel to assist in arbitration. Expenditures from the fund are financed through annual transfers from the annual tobacco Master Settlement Agreement.
Consequences of Not Funding this ProgramIf the state were found to be not dilengently enforcing the terms of the Master Settlement Agreement (MSA), there could be a potential loss of part or all of the annual payment made to the state pursuant to the MSA. In recent years, these payments have ranged between 50-60 million dollars per year and mainly fund programs of the Kansas Endowment for Youth fund. Program GoalsA. In the implementation and enforcement of the provisions of the Master Settlement Agreement (MSA) of 1999 resulting from the case of State ex rel. Stovall v. RJR, et al., the Division will identify and take action against participating manufacturers who violate the MSA and enforce the provisions of the Requirements for Sale of Cigarettes Act against Non-Participating Manufacturers (NPM). The Division is also responsible for the implementation and enforcement of the settlement agreement arising from the NPM adjustment arbitration. As a result of this settlement, the Division has assumed new enforcement obligations at increased costs to the Division. Civil Division: Bond ReviewProgram HistoryThe attorney general is authorized to fix, charge and collect fees for review and examination of the transcripts of the proceedings of municipalities for the issuance of municipal bonds under KSA 10-108.
Consequences of Not Funding this ProgramBond review is required by state statute and demanded by the market before bonds and notes are registered and sold to protect the governmental entities, taxpayers and purchasers by ensuring compliance with state law. State real property may be improperly disposed of or used in an illegal or unauthorized manner. Municipalities may enter into agreements that do not comply with state law. Program GoalsA. To review for legality all proposed rules and regulations. To review the issuance of bond and temporary notes for legality and sufficiency of associated transcripts of proceedings. To review contracts affecting state property, including deeds, easements, leases and special assessments. To review interlocal agreements submitted by local units of government. KSA 77-420, 10-108, 12-3425, 75-3743, 74-3264, 75-2131, 122904 and others. Objective #1: Review any proposed adoption, amendment, or revocation of agency rules and regulations pursuant to KSA 77-420 to determine whether the proposed action is within the scope of the agency's authority and appears to be consistent with applicable statutory and constitutional law. B. To review for legality all proposed rules and regulations. To review the issuance of bond and temporary notes for legality and sufficiency of associated transcripts of proceedings. To review contracts affecting state property, including deeds, easements, leases and special assessments. To review interlocal agreements submitted by local units of government. KSA 77-420, 10-108, 12-3425, 75-3743, 74-3264, 75-2131, 122904 and others. Objective #2: Perform an independent review of the legality of the issuance of bonds and notes by governmental entities and the sufficiency of the transcript of proceedings used by municipalities to issue bonds and temporary notes. C. To review for legality all proposed rules and regulations. To review the issuance of bond and temporary notes for legality and sufficiency of associated transcripts of proceedings. To review contracts affecting state property, including deeds, easements, leases and special assessments. To review interlocal agreements submitted by local units of government. KSA 77-420, 10-108, 12-3425, 75-3743, 74-3264, 75-2131, 122904 and others. Objective #3: Review easements, special assessments, deeds and leases on state property as statutorily required for form and/or substance. D. To review for legality all proposed rules and regulations. To review the issuance of bond and temporary notes for legality and sufficiency of associated transcripts of proceedings. To review contracts affecting state property, including deeds, easements, leases and special assessments. To review interlocal agreements submitted by local units of government. KSA 77-420, 10-108, 12-3425, 75-3743, 74-3264, 75-2131, 122904 and others. Objective #4: Review Interlocal Cooperation Act agreements as statutorily required for form and/or substance. Performance Measures
Civil Division: Contract General CounselProgram HistoryEffective June 1, 2017, S.B. 149, sec. 2(a) (Now codified in KSA 75-769) established that, "The attorney general may determine, fix and establish a system of legal representation charges and collect such charges from any state agency to which the attorney general provides legal services. The attorney general may determine the amount of legal representation charges due from the state agency by use of a schedule of fees and costs for legal services published by the attorney general or by entering into an agreement with a state agency for payment by such agency for legal services. Such schedule of fees and costs shall not exceed the amount of compensation established pursuant to KSA 22-4507, and amendments thereto, for attorneys appointed by the court to perform services for an indigent person.
Consequences of Not Funding this ProgramThe counseled agencies may not be able to access legal counsel trained in state legal and regulatory affairs on an affordable basis. Not using or under-utilizing legal counsel could result in violation of state law, expense to the state to defend and/or settle lawsuits, a delay in handling licensing discipline matters, and harm to the agencies' interests as the result of unfavorable contracts. By representing a number of smaller agencies, the OAG provides the most efficient and cost effective legal reporesentation for the State. The OAG would not be able to comply with its duty with respect to these important statutorily created entitites. Program GoalsA. To serve as general counsel for state boards and commissions that have no in-house counsel, helping them to pursue a proper course of conduct and avoid litigation through the provision of advice and consultation. Pursuant to KSA 75-769, the Office of the Attorney General has authority to charge legal representation charges to state agencies. To serve as the Attorney General's designee on certain statutorily created entities. KSA 77-423, 75-4101, 46-2303, 75-710, 66-106, 74-4206, 74-4908, 74-7029, 41-201, 75-1515, 75-1516, 74-8715, 77-8809. Objective #1: As general counsel for 29 boards and commissions that have no in-house counsel, attend administrative board meetings and hearings, draft orders, and assist with other legal matters as necessary. B. To serve as general counsel for state boards and commissions that have no in-house counsel, helping them to pursue a proper course of conduct and avoid litigation through the provision of advice and consultation. Pursuant to KSA 75-769, the Office of the Attorney General has authority to charge legal representation charges to state agencies. To serve as the Attorney General's designee on certain statutorily created entities. KSA 77-423, 75-4101, 46-2303, 75-710, 66-106, 74-4206, 74-4908, 74-7029, 41-201, 75-1515, 75-1516, 74-8715, 77-8809. Objective #2: Serve as the Attorney General's designee on statutorily created entities such as the State Rules and Regulations Board, State Records Board, Committee on Surety Bonds and Insurance, and the Joint Committee on State/Tribal Relations or as directed. Performance Measures
Civil Division: Defense LitigationPerformance Measures
Civil Division: Legal Opinions and Government Counsel DivisionProgram HistoryThis Division is responsible for researching and issuing written legal opinions requested by legislators, public agencies, and other officials; for annually updating guidelines to assist state agencies in evaluate whether proposed governmental actions may constitute a taking; for reviewing new and amended proposed agency rules and regulations; for reviewing bond and temporary note issue transcripts; and for reviewing deeds easements, leases, and special assessments on state property. The Division also serves as general counsel to 29 state boards and commissions that have no in-house counsel. The Division is also responsible for providing public education and training on the Kansas Open Meetings Act (KOMA) and the Kansas Open Records Act (KORA). In addition, the Division is responsible for investigating potential violations of the Kansas Architectural Accessibility Act. Since 1879, it has been a statutory responsibility for the Attorney General to consult with and advise county attorneys, and to research and draft formal written opinions, without fee, upon all questions of law submitted to him or her by the legislature, or either branch thereof, or by the governor, secretary of state, state treasurer, state board of education, or commissioner of insurance. KSA 75-704.
Consequences of Not Funding this ProgramThe Attorney General would not be able to comply with the long-standing statutory duties. Legislators, the governor, secretary of state, state treasurer, state board of education, commissioner of insurance, county attorneys and other state agencies or officials would not be able to benefit from the research and legal analysis of the Office of the Attorney General; opinions help to provide uniformity across the state on legal issues addressed. While we do not provide legal advice to legislators, public agencies and state or local public officials unless they are a client, we do provide resources and educational materials that will assist the person or entity to understand the law in order to draw their own legal conclusion in light of the particular facts. The consequence of not funding this program is a potential increase in costs to the public official or agency to obtain a basic understanding of the law. If this program is not funded, the State may be disadvantaged in litigation or unable to meet requirements imposed by the Legislature. Program GoalsA. To provide formal written opinions to the Legislature, Governor, Secretary of State, State Treasurer, State Board of Education, Commissioner of Insurance and other public officials that may settle a question of law or provide a certain and uniform method of analyzing a legal question in an unbiased manner. To provide County and District Attorneys with consultation and advice in all matters pertaining to their official duties. When assigned by Administration, to appropriately respond to emails, letters, and other communication from legislators, public agencies and state or local public officials requesting information on a legal issue. To annually update guidelines to assist state agencies in evaluating proposed governmental actions and in determining whether such actions may constitute a taking. To assist the Office of the Attorney General with legal research and special projects, such as promulgating regulations in response to a newly enacted state law. KSA 75-704, KSA 77701 et seq. Objective #1: To research and issue written legal opinions requested by legislators, public agencies, and officials. B. To provide formal written opinions to the Legislature, Governor, Secretary of State, State Treasurer, State Board of Education, Commissioner of Insurance and other public officials that may settle a question of law or provide a certain and uniform method of analyzing a legal question in an unbiased manner. To provide County and District Attorneys with consultation and advice in all matters pertaining to their official duties. When assigned by Administration, to appropriately respond to emails, letters, and other communication from legislators, public agencies and state or local public officials requesting information on a legal issue. To annually update guidelines to assist state agencies in evaluating proposed governmental actions and in determining whether such actions may constitute a taking. To assist the Office of the Attorney General with legal research and special projects, such as promulgating regulations in response to a newly enacted state law. KSA 75-704, KSA 77701 et seq. Objective #2: Consult with and advise county and district attorneys, when requested by them, in all matters pertaining to their official duties. When assigned by Administration, appropriately respond to emails, letters, and other communication from legislators, public agencies and state or local public officials requesting information on a legal issue. C. To provide formal written opinions to the Legislature, Governor, Secretary of State, State Treasurer, State Board of Education, Commissioner of Insurance and other public officials that may settle a question of law or provide a certain and uniform method of analyzing a legal question in an unbiased manner. To provide County and District Attorneys with consultation and advice in all matters pertaining to their official duties. When assigned by Administration, to appropriately respond to emails, letters, and other communication from legislators, public agencies and state or local public officials requesting information on a legal issue. To annually update guidelines to assist state agencies in evaluating proposed governmental actions and in determining whether such actions may constitute a taking. To assist the Office of the Attorney General with legal research and special projects, such as promulgating regulations in response to a newly enacted state law. KSA 75-704, KSA 77701 et seq. Objective #3: Annually update guidelines to assist state agencies in evaluating proposed governmental actions and in determining whether such actions may constitute a taking. Assist the Attorney General with research and special projects, such as responding to requirements imposed by the Legislature or other authority and anticipating legal developments in the State to put the State in the best posture in the event litigation arises. D. To respond to inquiries of the public, as directed by Administration, by providing information and directing individuals to appropriate public agencies or private entities for assistance as needed. Objective #1: Respond to miscellaneous correspondence, email, and telephone inquiries from the public, as directed by Administration. E. To respond to inquiries of the public, as directed by Administration, by providing information and directing individuals to appropriate public agencies or private entities for assistance as needed. Objective #2: Catalogue and disseminate written legal opinions as they are issued. Assist the public in accessing older opinions. F. Investigate complaints that suggest potential Kansas Architectural Accessibility Act (KAAA) violations, or refer investigation of such matters to local prosecutors. KSA 58-1304. Performance Measures
Civil Division: Licensing and Inspections (Bail Enforcement Licensing Unit)Program HistoryThe Bail Enforcement Agent Unit began under the Attorney General's Office in 2016. The Bail Enforcement Agent Licensing Act (BEALA), or "bounty hunter" licensing act. The BEALA was instituted to license BEAs (those that track down persons who have skipped court proceedings while on a bail bond - but also do not have the approval/licensure of a Court or the Kansas Insurance Department to issue bail bonds). This unit is responsible for processing new and renewal applications and monitoring compliance with license requirements.
Consequences of Not Funding this ProgramThe elimination of funding would result in an inability to process new applications and administer those already licensed, eliminate the ability to litigate challenged administrative actions and eliminate the ability to investigate and/or litigate complaints against licensees and those who are unlicensed in accordance with the Kansas Consumer Protection Act. Performance Measures
Civil Division: Licensing and Inspections (Charitable Organizations)Program HistoryThe Kansas Charitable Organizations and Solicitations Act was passed in 1988. The Act governs the registration of charities and solicitation requirements and violations. In 2021, the Kansas Legislature amended the Act, adding registration of charitable organizations, fund raisers, and professional solicitors to the purview of the Kansas Attorney General. Now, both the registration of these entities and the enforcement of registration or solicitation violations are the responsibility of the Consumer Protection Division. Violations of the Kansas Charitable Organizations and Solicitations Act may be prosecuted by the Attorney General, or a county or district attorney. The Attorney General has investigative subpoena authority, and is authorized to bring an action in civil court, or obtain a consent judgment, for violation of provisions of the Act.
Consequences of Not Funding this ProgramThe Kansas Charitable Organizations and Solicitations Act has no private remedy. Only the Attorney General or County and District Attorneys are authorized to enforce the Act. If the charitable work of the agency is not funded, consumer complaints and reports from volunteers, employees and others regarding fraudulent charitable solicitation practices will not be investigated or pursued. Performance Measures
Civil Division: Licensing and Inspections (Concealed Carry Licensing Unit)Program HistoryIn 2006, the Personal and Family Protection Act was signed into law. The Act's passage marked the first time that licensed concealed carry of handguns was allowed in Kansas. As a result, the Attorney General was tasked with overseeing the licensing process; as a result, the Concealed Carry Licensing Unit (CCLU) was created. The CCLU is the centralized unit in Kansas which administers and enforces the licensing provisions of the Act. The CCLU section reviews original concealed carry of handgun applications and either approves or denies them, suspends or revokes licensees that come out of compliance with applicable statutes and reviews renewal applications for those that reapply and approves eligible applicants or denies those that are ineligible; The CCLU also monitors recognition of the Kansas licensees by other jurisdictions and assists with litigation involving denials, suspensions and revocations through administrative actions. In addition, the CCLU approves or denies applications to be a concealed carry handgun training instructor and monitors those instructors for continued compliance. The CCLU also provides instruction and education to various groups across the state.
Consequences of Not Funding this ProgramThe elimination of funding would result in the inability to issue concealed carry licenses or answer questions for those already licensed. The reduction in funding would also eliminate the ability to renew licenses and would also prevent the revocation of licensees who are not in compliance with state law and that may be prohibited from possessing a firearm. The section would also be unable to defend administrative actions which would eliminate due process to applicants or licensees who were previously denied a license or had their license revoked. Additionally, concealed carry instructors would no longer be certified or regulated to provide firearms safety classes. Performance Measures
Civil Division: Licensing and Inspections (Private Detective Unit)Program HistoryThe agency provides licensing services and maintains accurate information on persons and agencies licensed as private detectives and agencies in the State of Kansas and maintains the licensing records in a manner that support office use and public access. This fund and the responsibilities were brought over from the Kansas Bureau of Investigation on July 1, 2012.
Consequences of Not Funding this ProgramThe PDLU would be unable to pay the overhead and staffing costs associated with the administration of new licenses and certifications issued by the PDLU; the litigation of any challenged administrative action that is taken/proposed against an applicant or licensee within the reach of the PDLU. While discretionary in most instances, Licenses that are subject to suspension, revocation or other administrative process would not have those actions taken against them - resulting in persons being licensed by the State when the law may not allow them to hold such status; Applicant's inability to challenge a denial of a license/permit/certification; and persons remaining licensed by the State when the law may not allow them to hold such status. The PDLU would be unable to pay OAH administrative appeal costs, resulting in, at best, an in-house employee serving as an administrative hearing officer and pulling them away from their other necessary duties or a lack of any administrative actions being taken against problematic licensees because those funds cannot be covered. Licenses would expire with no advanced warning and no recourse; licensees would be unable to renew their licensures/certifications where the law generally requires an approval unless disqualified; licensees would be unable to challenge the lack of an approval or denial of their renewal application(s) for continued licensure/certification. The law generally requires an approval unless shown disqualified; Overall, applicants and licensees would generally be deprived of the due process that current Kansas statutes afford them. Performance Measures
Civil Division: Licensing and Inspections (Roofing Registration)Program HistoryThe Kansas Roofing Registration Act (KRRA) went into effect July 1, 2013. The KRRA helps ensure Kansas consumers contract with reputable roofing contractors. Pursuant to KSA 50-6,138, the KRRA is a part of and supplemental to the KCPA, and any violation of the KRRA is deemed to be a deceptive or unconscionable act or practice under the KCPA.
Consequences of Not Funding this ProgramThis Roofing Registration Unit was created pursuant to legislation authorizing the Attorney General to administer and implement the provisions of the KRRA. This program is funded by fees generated by the program (registration fees, judgments, etc.). Not funding the program would leave Kansas consumers without the information that they need to protect themselves from unscrupulous contractors. Program GoalsA. To provide efficient, effective and ethical enforcement of the Kansas Roofing Registration Act, KSA 50-6,121 et seq. Objective #1: To receive, process, investigate, and publish annual roofing registration applications in a timely manner. B. To provide efficient, effective and ethical enforcement of the Kansas Roofing Registration Act, KSA 50-6,121 et seq. Objective #2: To investigate and recommend for prosecution any violations of the Roofing Registration Act. Performance Measures
Civil Division: Licensing and Inspections (Scrap Metal Licensing Unit)Program HistoryOn July 1, 2015 the "Scrap Metal Theft Reduction Act" (the Act) became effective by adding and amending laws related to scrap metal dealer registration and scrap metal sales. Additionally, the law amended certain criminal provisions related to scrap metal theft. In 2015, the Attorney General had authority over the implementation, administration, and enforcement of the Act, including creating and operating a registration process, creating and maintaining a database of registered dealers and transactions, and investigating and prosecuting violations of the Act. The Act established the Scrap Metal Theft Reduction Fee Fund to be administered by the Attorney General, which would be credited with all fees, charges, or penalties collected by the Attorney General under the Act. Expenditures from the Fund are used for the administration of the duties, functions, and operating expenses incurred under the Act. In 2017, the Kansas State Legislature amended the law, delaying implementation of certain provisions of the Act. In 2018, that delay was extended until January 1, 2019. When the Act was initially adopted, it was incorrectly estimated that there were approximately 200 scrap metal dealers in the State of Kansas, indicating that the revenue generated would likely have been sufficient to operate the program. However, at the time the Act was suspended, only 75 scrap metal dealers had completed the registration process. This resulted in a significant underfunding of the program. Because the Kansas State Legislature did not appropriate funds for this program until a year following the initial adoption, there was a delay in the request for proposal (RFP) process to create the transactional database required by the law. At the time of the suspension of this program, bids were undergoing review as part of the RFP process. In 2019, the legislature transferred responsibilities for the law enforcement database to the Kansas Bureau of Investigation. Prior to the Act, this Division has no history of enforcement of scrap metal related offenses. The Division educates the public, law enforcement officials, members of the legal profession, and providers of goods and services regarding issues relating to the KCPA and other consumer statutes in order to reduce or prevent consumer fraud.
Consequences of Not Funding this ProgramThis program was created in order to register all scrap metal dealers, combat scrap metal theft, and provide law enforcement a resource to track scrap metal sales throughout the state. Program GoalsA. To provide efficient, effective, and ethical enforcement of the Scrap Metal Theft Reduction Act (SMTRA), KSA 50-6,109 et seq. Objective #1: To receive, process, investigate, and publish annual scrap metal dealer registration applications in a timely manner. B. To provide efficient, effective, and ethical enforcement of the Scrap Metal Theft Reduction Act (SMTRA), KSA 50-6,109 et seq. Objective #2: To enforce the Scrap Metal Theft Reduction Act through suspension and revocation of registration certificates. Performance Measures
Civil Division: Racial ProfilingProgram HistoryTo carry out the Office of the Attorney General's duties under the racial or other biased based policing statutes, KSA 22-4606 et seq, including processing and reviewing complaints received by the OAG; collecting and publishing law enforcement agency Racial or Other Biased Based Policing annual reports; and providing training and community outreach on racial and other bias based policing. The LOGiC Division assumed the aministrative responsibilities for this activity on May 1, 2017.
Consequences of Not Funding this ProgramThe program is not currently funded. The administrative responsibilities of the act were absorbed into this division. Program GoalsA. To carry out the Office of the Attorney General's duties under the racial or other biased based policing statutes, KSA 22-4606 et seq, including processing and reviewing complaints received by the OAG; collecting and publishing law enforcement agency Racial or Other Biased Based Policing annual reports; and providing training and community outreach on racial and other bias based policing. The LOGiC Division assumed responsibility for this activity on May 1, 2017. Objective #1: Review each racial or other biased based policing complaint filed with this office and make a determination of the appropriate action on each complaint. B. To carry out the Office of the Attorney General's duties under the racial or other biased based policing statutes, KSA 22-4606 et seq, including processing and reviewing complaints received by the OAG; collecting and publishing law enforcement agency Racial or Other Biased Based Policing annual reports; and providing training and community outreach on racial and other bias based policing. The LOGiC Division assumed responsibility for this activity on May 1, 2017. Objective #2: Collect and publish law enforcement agency Racial and Other Biased Based Policing annual reports. Performance Measures
Criminal DivisionProgram HistoryThe Criminal Litigation Division maintains a group of highly skilled prosecutors who assist county and district attorneys in prosecuting the most difficult and demanding criminal cases throughout Kansas. The Division develops and facilitates an annual forum for county and district attorneys to discuss issues related to the prosecution of homicides and child sex crimes in Kansas. The Division hosts regional Attorney General Calls that provide an opportunity to present continuing legal education on emerging prosecution and appellate issues and provides special training to law enforcement officers and officials, victims' advocates, and court services personnel on major criminal issues. The Division is also responsible for the investigation and licensing of applicants for concealed carry, private detective, and bail enforcement agent permits.
Consequences of Not Funding this ProgramLack of funding will eliminate the ability of the Kansas Attorney General's Office to prosecute homicides and child sex crimes, which are often the most difficult and demanding cases, throughout Kansas. Any decrease in experienced prosecutorial capacity would most negatively impact counties with smaller populations and more limited resources. The lack of prosecution capacity in homicide and child sex crime cases would further impact the victims or their family members ability to achieve justice for those criminal acts in a timely manner. Lack of funding will decrease the ability for Kansas prosecutors and law enforcement to receive specialized training. This lack of training will further impact Kansas prosecutors' ability to effectively handle cases, particularly in jursidictions with a smaller population and more limited training resources. The overally impact of a decrease in funding would severely undermine public confidence in the criminal justice system. Program GoalsA. Build and sustain a group of highly skilled prosecutors who can efficiently, effectively, and ethically prosecute persons charged with violations of Kansas criminal laws. Kan. Constitution, Article I, § 1; KSA 22-2202(17), KSA 75-108, KSA 75-702, KSA 75-708, and amendments thereto; State ex rel. Stephan v. Reynolds, 234 Kan. 574, 673 P.2d 1188 (1984). Objective #1: Utilizing well trained and resourced Assistant Attorneys General, prosecute the most difficult and demanding cases throughout Kansas. B. Build and sustain a group of highly skilled prosecutors who can efficiently, effectively, and ethically prosecute persons charged with violations of Kansas criminal laws. Kan. Constitution, Article I, § 1; KSA 22-2202(17), KSA 75-108, KSA 75-702, KSA 75-708, and amendments thereto; State ex rel. Stephan v. Reynolds, 234 Kan. 574, 673 P.2d 1188 (1984). Objective #2: Build positive relationships with state and local law enforcement officers and officials to foster core competencies in the investigation and prosecution of homicides, child sex crimes, illegal drug manufacture and distribution crimes, and crimes involving public officials. C. This section supports the prosecution section through witness interviews, criminal history checks, and subpoena service. In addition, it provides training, assistance, and investigation support for other law enforcement-related investigations in accordance with the Kansas Attorney General's statutory and constitutional duties. The section also supports investigations conducted by the Livestock/Branding Unit within the section, and Special Agents of the section that are assigned to the Northeast Kansas Crimes Against Children initiative, as well as other investigative personnel within the Attorney General's Office. Objective #1: Provide certified law enforcement capability within the Kansas Attorney General's Office. D. This section supports the prosecution section through witness interviews, criminal history checks, and subpoena service. In addition, it provides training, assistance, and investigation support for other law enforcement-related investigations in accordance with the Kansas Attorney General's statutory and constitutional duties. The section also supports investigations conducted by the Livestock/Branding Unit within the section, and Special Agents of the section that are assigned to the Northeast Kansas Crimes Against Children initiative, as well as other investigative personnel within the Attorney General's Office. Objective #2: Provide certified law enforcement capability as an agency member of the Northeast Kansas Crimes Against Children initiative. Criminal Division: Economic Crimes UnitPerformance Measures
Criminal Division: Economic Crimes Unit (Abuse, Neglect and Exploitation)Program HistoryIn July of 2016, KSA75-723 was amended to allow for the Attorney General to assist in the investigation and prosecution of cases involving abuse, neglect, or exploitation of adults. This required the ANE unit to be removed from the Victim Services Division. At that time, the Attorney General made a decision to create a new division entitled Fraud and Abuse Litigation Division. The purpose of doing this was not just to provide a home for the ANE unit, but also to fulfill a broader vision regarding the prosecution of cases involving a financial component. The intent of the Fraud and Abuse Litigation Division is to be a state wide resource assisting local authorities in investigating and prosecuting very difficult cases involving vulnerable adults. In addition to providing direct investigation and prosecution resources, the division also provides an educational resource to lawyers, law enforcement, and the general public.
Consequences of Not Funding this ProgramA return to the systemic landscape prior to the Kaufman case in which cases of abuse, neglect, and exploitation go undetected or are not investigated or prosecuted timely or at all. There will be no central resource to provide education to law enforcement and prosecution to effectively, consistently, and ethically investigate and litigate cases of abuse, neglect, and exploitation of adults. Also, the general public will have less opportunity to be provided information which will protect themselves or a loved one from being a victim of abuse, neglect, or exploitation. Program GoalsA. Participate in the review, referral, investigation, prevention, and prosecution of abuse, neglect, and exploitation cases involving adults pursuant to KSA 75-723. Objective #1: Review and follow-up all law enforcement referrals and substantiated reports of abuse, neglect, and exploitation for adults. B. Participate in the review, referral, investigation, prevention, and prosecution of abuse, neglect, and exploitation cases involving adults pursuant to KSA 75-723. Objective #2: Prevention through education of law enforcement and prosecutors. C. To develop and maintain a coordinated response to prevent serious harm and deaths of vulnerable adults as per KSA 75-754 and amendments thereto. The Silver Alert tracking responsibilities were shifted from the Victim Service division to the Abuse, Neglect & Exploitation Unit of the Fraud and Abuse Litigation Division of the OAG starting in SFY 2021. Performance Measures
Criminal Division: Economic Crimes Unit (Elder Abuse MDT)Program HistoryIn the spring of 2021, the legilature passed HB 2114 which in part became KSA 75-782. This bill was brought to the legislature by the Elder and Dependent Adult Abuse Prevention Council. The Council was formed in 2019 and one of its primary purposes was to research multidisciplinary teams, also known as MDTs, in the context of the investigation of abuse, neglect, and exploitation of elder and dependent adults. The purpose of the bill was to improve communication and coordination between multiple agencies which investigate cases of abuse, neglect, and exploitation. The statutes requires specific agencies such as the County or District Attorney, the Sheriff, Department of Children and Familes, Department of Aging and Disability Services, and State Long-term Care Ombudsman to participate. It also allows for additional members as needed by the particular team. The teams are to coordinate investigations of elder and dependent adult abuse within the judicial district and is also allowed to identify opportunities to improve policies and procedures in the notification and response to such cases.
Program GoalsA. To facilitate the convening of an elder and dependent adult multidisciplinary team in each judicial district. The purpose of such teams is to coordinate investigations of elder and dependent adult abuse, as well as identifying opportunities with local jurisdictions to improve policies and procedures in the notification and response to abuse, neglect, and exploitation of elder and dependent adults. KSA 75-782 and amendments thereto. Performance Measures
Criminal Division: Economic Crimes Unit (Livestock Investigation/Brand Unit)Program HistoryThe Livestock Investigation/Brand Unit of the Criminal Litigation Division is a cooperative effort between the Attorney General of Kansas and the Kansas Secretary of Agriculture. The partnership provides the ability for sworn law enforcement officers employed by the State of Kansas to assist local law enforcement officers in rural and frontier Kansas counties in the investigation of criminal offenses associated with livestock, including investigations that are multi-jurisdictional in nature. The Unit, consisting of two Kansas certified law enforcement officers (Special Agents) commissioned by the Attorney General, was originally established in FY 2014, as a unit of the Attorney General's Consumer Protection Division. In FY 2016, the Unit was moved from the Consumer Protection Division to the Criminal Litigation Division, as a unit in the Investigation Section. Additional investigative resources and support for the unit is provided by the Special Agent in Charge, Investigation section.
Consequences of Not Funding this ProgramThere would be no law enforcement entity to investigate livestock crimes with resources to conduct multi-jurisdictional investigations. Program GoalsA. The section supports the prosecution section through witness interviews, criminal history checks, and subpoena service. In addition, it provides training, assistance, and investigation support for other law enforcement-related investigations in accordance with the Kansas Attorney General's statutory and constitutional duties. The section also supports investigations conducted by the Livestock/Branding Unit within the section, and Special Agents of the section that are assigned to the Northeast Kansas Crimes Against Children initiative, as well as other investigative personnel within the Attorney General's Office. B. To provide efficient, effective, and ethical enforcement of the Kansas Brand Law. KSA 47-414 et seq. Objective #1: To receive, process, investigate and act on complaints pertaining to the Kansas Brand Law, and ethically prosecute or otherwise enforce the matters falling within the parameters of the Kansas Brand Law. Performance Measures
Criminal Division: Major CrimesPerformance Measures
Criminal Division: Medicaid Fraud Control UnitProgram HistoryThe Medicaid Fraud and Abuse Division (the Division) was established in 1995 and operates under the statutory authority granted at KSA 75-725, KSA 75-726, and KSA 21-5925, et seq., to comply with the requirements of 42 USC 1396a(a)(61) and 42 USC 1396b(q). The Division is the only state entity responsible for receiving, investigating and prosecuting, either civilly or criminally, all cases of suspected fraud by Medicaid providers committed against the Kansas Medicaid program. The Division is tasked with recovering state and federal tax monies fraudulently obtained by Medicaid providers, and for returning said monies to the appropriate state and federal agencies. In addition, the Division receives, investigates and prosecutes allegations of patient abuse, neglect, or exploitation or misappropriation of patients' private funds committed by healthcare providers in residential care facilities, home health care and, other non institutional settings receiving Medicaid funds.
Consequences of Not Funding this ProgramIf Kansas had no MFCU, it would lose eligibility to receive all federal money (the federal share of the more than $4 Billion spent by Kansas on Medicaid provider claims in FY 2021, according to the Kansas Medical Assistance Report for Fiscal Year 2021, published by KDHE, Division of Health Care Finance), it now relies on to provide Medicaid benefits. Program GoalsA. To efficiently, effectively, and ethically investigate and litigate against providers found to be committing fraud in or against the Kansas Medicaid program, recover state and federal monies fraudulently obtained by Medicaid providers, and reimburse the appropriate state and federal agencies. Objective #1: Staff a division, independent of the State Medicaid Agency (the Kansas Department of Health and Environment, Division of Health Care Finance), that will develop and implement specific procedures to effectively and efficiently investigate and prosecute criminal instances of fraud by Medicaid providers. B. To efficiently, effectively, and ethically investigate and litigate against providers found to be committing fraud in or against the Kansas Medicaid program, recover state and federal monies fraudulently obtained by Medicaid providers, and reimburse the appropriate state and federal agencies. Objective #2: Staff a division, independent of the State Medicaid Agency (the Kansas Department of Health and Environment, Division of Health Care Finance), that will develop and implement specific procedures to effectively and efficiently investigate and litigate civil instances of fraud by Medicaid provider. C. To review allegations of patient abuse, neglect, or the exploitation or misappropriation of patients' private funds committed by healthcare providers in residential care facilities that receive Medicaid funds, to efficiently, effectively and ethically investigate those allegations with substantial potential for criminal prosecution and to prosecute the perpetrators of such misconduct or refer cases to agencies for appropriate sanctions. Objective #1: Develop and implement procedures to effectively and efficiently review, investigate and prosecute cases of patient abuse, neglect or misappropriation of patients' private funds. D. To provide for the efficient and effective education of the public and health care providers to aid in the fight against Medicaid fraud and abuse through awareness and cooperation, as well as the coordination of private, state and federal resources. 42 USC § 1396b(q)(3); KSA 75-708. Objective #1: Create procedures to ensure that Medicaid providers and the general public are provided with relevant information concerning Medicaid provider fraud and vulnerable adult abuse, neglect and exploitation. Performance Measures
Criminal Division: Traffic Safety Resource ProsecutorsProgram HistoryThe TSRP position orginated in 2008 as a partnership between the Shawnee County DAs office and the OAG. The position was formalized after a grant funding review by the OAG. The position provides expert review and analysis of current DUI law, practice and case study for prosecutors and other interested parties across the state.
Consequences of Not Funding this ProgramIf this Federally funded grant position was eliminated, there would be a reduction in Federal transportation dollars received by KDOT. By the state having this position, it allows the state to qualify for additional Federal funding. Additionally, prosecutors and law enforcement would not have a statewide resource for information and training on the current best practices and potential legal issues they may face when detecting, arresting and prosecuting impaired drivers. Program GoalsA. The Traffic Safety Resource Prosecutor (TSRP) program is funded by the National Highway Transportation Safety Administration (NHTSA) through a grant from the Kansas Department of Transportation. The TSRP provides training, education and technical support to prosecutors and law enforcement agencies throughout the state on traffic crimes and safety issues. While the TSRP's focus is on alcohol and drug impaired driving, the TSRP also serves as a resource in other areas of traffic safety including distracted driving, occupant restraint, and other highway safety issues. Objective #1: Provide support to local prosecutors to review and prosecute traffic safety crimes with an emphasis on DUI fatalities. B. The Traffic Safety Resource Prosecutor (TSRP) program is funded by the National Highway Transportation Safety Administration (NHTSA) through a grant from the Kansas Department of Transportation. The TSRP provides training, education and technical support to prosecutors and law enforcement agencies throughout the state on traffic crimes and safety issues. While the TSRP's focus is on alcohol and drug impaired driving, the TSRP also serves as a resource in other areas of traffic safety including distracted driving, occupant restraint, and other highway safety issues. Objective #2: Produce or co-produce with one or more agencies or organizations, training events relating to detection and apprehension of impaired drivers for law enforcement or in conjunction with prosecutors. C. The Traffic Safety Resource Prosecutor (TSRP) program is funded by the National Highway Transportation Safety Administration (NHTSA) through a grant from the Kansas Department of Transportation. The TSRP provides training, education and technical support to prosecutors and law enforcement agencies throughout the state on traffic crimes and safety issues. While the TSRP's focus is on alcohol and drug impaired driving, the TSRP also serves as a resource in other areas of traffic safety including distracted driving, occupant restraint, and other highway safety issues. Objective #3: Inform prosecuting attorneys and law enforcement officers of significant developments about the DUI and Implied Consent laws as well as other traffic safety related news including upcoming training opportunities. Performance Measures
Criminal Division: Victims Rights UnitPerformance Measures
Office of Medicaid Inspector GeneralProgram HistoryThe Inspector General Division is a new division transferred from KDHE on July 1, 2017, with the amendments in SB 149 to KSA 2016 Supp. 75-7427. The Inspector General (IG), which was created by the 2007 Kansas Legislature in KSA 75-7427, was the first statutorily created Office of Inspector General in Kansas. The purpose of the inspector general is to establish a full-time program of audit, investigation and performance review to provide increased accountability, integrity and oversight of the state Medicaid program, the state mediKan program and the state children's health insurance program and to assist in improving agency and program operations and in deterring and identifying fraud, waste, abuse and illegal acts.
Consequences of Not Funding this ProgramThe State of Kansas would be left without an independent watchdog to ensure that Medicaid funds are being properly managed. The office is also critical in identifying areas to increase the efficiency and effectiveness of Medicaid operations. Program GoalsA. To establish a full-time program of audit, investigation and performance review to provide increased accountability, integrity and oversight of the state Medicaid program, the state mediKan program and the state children's health insurance program and to assist in improving agency and program operations and in deterring and identifying fraud, waste, abuse and illegal acts. Objective #1: Staff an office, independent of the State Medicaid Agency (the Kansas Department of Health and Environment, Division of Health Care Finance), that will develop and implement specific procedures to effectively and efficiently audit, investigate and provide performance reviews to increase accountability, integrity and oversight of the State Medicaid Agency programs. Performance Measures
Public ProtectionProgram HistoryThis includes efficient, effective, and ethical enforcement of consumer protection laws, including the Kansas Consumer Protection Act, the Kansas Charitable Organizations and Solicitations Act, the Kansas False Claims Act, the Kansas Roofing Registration Act, the Kansas Wayne Owen Act, the Kansas No Call Act, the Scrap Metal Theft Reduction Act, the unauthorized practice of law statutes, consumer information data protection laws, and state and federal antitrust laws.
Consequences of Not Funding this ProgramThere would not be an entity authorized to enforce the Kansas Consumer Protection Act throughout the state, that work would be shifted to the County and District level. By not enforcing the act, businesses would be allowed to conduct business in deceptive and unconscionable ways without consequence, other than the private action of consumers. The less informed consumers are of common schemes and scams, the less equipped consumers will be to protect themselves from the financial and personal hardships that they might suffer as a result of falling victim to these fraud. The KCPA specifically provides penalties for fraud against vulnerable consumers, and much of the education and outreach of the Office of Attorney General is to that demographic, e.g. senior citizens. Performance Measures
Public Protection: AntitrustProgram HistoryKansas was the first state in the Union to enact a state-level antitrust law of general application when the first version was enacted in 1889, before the federal Sherman Antitrust Act of 1890 was passed. The Kansas Restraint of Trade Act was first enacted in 1897. Antitrust was first reported as a complaint category by the Kansas Attorney General in the 1999 Annual Report of the Consumer Protection Division. There were 14 antitrust complaints filed that year. Major revisions to the Kansas Restraint of Trade Act were passed in both 2000 and 2013. In 2000, criminal antitrust enforcement was repealed, certain antiquated provisions were removed, and the Attorney General was given modern investigative powers, including administrative subpoena power. At that time, enforcement power for the Act was concentrated in the Office of the Attorney General, rather than in county and district attorneys' offices. To the extent the State of Kansas is involved in antitrust litigation, the Attorney General is the state's litigator. In 2013, the Act was further revised to clarify the law's application, and synchronize its application with federal antitrust laws.
Consequences of Not Funding this ProgramHarm to the economy of the state and consumers due to unchecked anticompetitive conduct. Inability to adequately comply with the enforcement requirements of KSA 50-109 or adequately represent the interests of the state and its consumers. The Act concentrates enforcement power in the Attorney General, so without adequate funding to enforce these statutes, there would be little to no antitrust enforcement in the State of Kansas, absent a few individual actions for individual damages. Antitrust investigation and litigation tends to be a long term process, frequently spanning several years by the time investigation, litigation, settlement or judgment, and appeals are complete. If an Assistant Attorney General is not engaged and involved at each step of the process, the State could lose out on and forego recovery in the matter. Program GoalsA. To provide efficient, effective and ethical enforcement of state and federal antitrust laws on antitrust matters referred to the office, ensure that each allegation is examined by an Assistant Attorney General, and that appropriate action is taken. KSA 50-101 to 50-1,105. Performance Measures
Public Protection: Charitable AssetsPerformance Measures
Public Protection: Charitable OrganizationsProgram HistoryThe Kansas Charitable Organizations and Solicitations Act was passed in 1988. The Act governs the registration of charities and solicitation requirements and violations. In 2021, the Kansas Legislature amended the Act, adding registration of charitable organizations, fund raisers, and professional solicitors to the purview of the Kansas Attorney General. Now, both the registration of these entities and the enforcement of registration or solicitation violations are the responsibility of the Consumer Protection Division. Violations of the Kansas Charitable Organizations and Solicitations Act may be prosecuted by the Attorney General, or a county or district attorney. The Attorney General has investigative subpoena authority, and is authorized to bring an action in civil court, or obtain a consent judgment, for violation of provisions of the Act.
Consequences of Not Funding this ProgramThe Kansas Charitable Organizations and Solicitations Act has no private remedy. Only the Attorney General or County and District Attorneys are authorized to enforce the Act. If the charitable work of the agency is not funded, consumer complaints and reports from volunteers, employees and others regarding fraudulent charitable solicitation practices will not be investigated or pursued. Program GoalsA. To provide efficient, effective and ethical legal advocacy on behalf of the State of Kansas in matters relating to the enforcement of the Kansas Charitable Organizations and Solicitations Act, KSA 17-1767 & 1768. Objective #1: To receive, process, and publish annual registration applications of charitable organizations, professional fund raisers, and professional solicitors employed by charitable organizations in a timely manner. B. To provide efficient, effective and ethical legal advocacy on behalf of the State of Kansas in matters relating to the enforcement of the Kansas Charitable Organizations and Solicitations Act, KSA 17-1767 & 1768. Objective #2: To receive, process, investigate and act on consumer complaints pertaining to the Kansas Charitable Organizations and Solicitations Act and effectively, efficiently, and ethically prosecute or otherwise enforce the Act against charitable organizations or solicitors. Performance Measures
Public Protection: Data BreachesPerformance Measures
Public Protection: False ClaimsPerformance Measures
Public Protection: KWOAPerformance Measures
Public Protection: No CallPerformance Measures
Public Protection: Open Government EnforcementProgram HistoryEffective July 2015, the Kansas Legislature expanded the investigatory and enforcement authority of the attorney general and county/district attorneys under both the Kansas Open Meetings Act and the Kansas Open Records Act. Beginning in January 2016, the enforcement duties were transferred to the Civil Litigation Division from the Legal Opinions and Government Counsel (LOGIC) Division.
Consequences of Not Funding this ProgramState agencies and employees would still need this service. Private attorneys would have to be employed to provide this service. Questions from the public would go unanswered as there would be no one to educate the public because private attorneys will not provide that service. Program GoalsA. Effective July 2015, the Kansas Legislature expanded the investigatory and enforcement authority of the attorney general and county/district attorneys under both the Kansas Open Meetings Act and the Kansas Open Records Act. Beginning in January 2016, the enforcement duties were transferred to the Civil Litigation Division from the Legal Opinions and Government Counsel (LOGIC) Division. Objective #1: Investigate possible violations of Kansas Open Government laws and take appropriate action when violations are found. Performance Measures
Public Protection: Sexually Violent Predator ProgramProgram HistoryTo provide efficient, effective and ethical legal representation on behalf of the State of Kansas in civil commitment proceedings for the extremely dangerous class of individuals determined to be sexually violent predators. KSA 59-29a01 et seq,. Kansas v. Hendricks, 521 U.S. 346, 117 S. Ct. 2072, 138 L. Ed. 2d. 501(1997). This program is administered by the Civil Litigation Division in cooperation with the Criminal Litigation Division.
Consequences of Not Funding this ProgramPublic safety would be threatened and the diagnosed dangerous sexually violent predators would not receive needed treatment, care, and restraint required for the small subset of individuals deemed suitable for the program. Program GoalsA. To provide efficient, effective and ethical legal representation on behalf of the State of Kansas in civil commitment proceedings for the extremely dangerous class of individuals determined to be sexually violent predators. KSA 59-29a01 et seq,. Kansas v. Hendricks, 521 U.S. 346, 117 S. Ct. 2072, 138 L. Ed. 2d. 501(1997). This program is administered by the Civil Litigation Division in cooperation with the Criminal Litigation Division. Objective #1: Ensure safety of the public and the continuing care and treatment of individuals determined to be sexually violent predators by advocating for the commitment of such individuals until such time as the individual's mental abnormality or personality disorder has changed so that the individual is safe to be at large among the general public. Performance Measures
Public Protection: Unauthorized Practice of LawPerformance Measures
Solicitor's DivisionProgram HistoryThe Solicitor Division was created as a free-standing Division within the Office of Attorney General at the beginning of FY 2017. The Division as it now stands was made up of components that were housed within the Administration, Civil Litigation, and Criminal Litigation Divisions of the OAG. Within the Solicitor Division are housed four programs: Civil Appeals, Criminal Appeals, Contracted County Criminal Appeals, and Review of Notices of Constitutional Challenges. Civil Appeals: In FY 2017 the new freestanding Solicitor Division was established with two Civil appeals attorneys. Criminal Appeals: Starting with Fiscal Year 2017, the Criminal Appeals program was folded into the new freestanding Solicitor Division. Contracted County Appeals: In 2014, the Attorney General was granted new statutory authority to allow the attorney general's office to enter into contracts with county and district attorneys to handle the appeals from locally prosecuted criminal cases. Commencing in FY 2015 the OAG began contracting with County and District Attorneys to handle their criminal appeals. Participation has grown each year and interest has been expressed by several additional counties. Review of Notices of Constitutional Challenges: New Section 1 of 2016 Senate Bill 334, codified at K.S.A 75-764, requires that notice be provided to the Attorney General or prosecuting attorney, as appropriate, when the validity of a Kansas law is challenged on grounds that the law violates the state constitution, federal constitution, or federal law. All notices sent to the Attorney General are directed to the Solicitor Division for handling. Extraditions: In 2021, this responsibility was transferred to the Solicitor Division from the Criminal Division.
Program GoalsA. KSA 75-764 requires that notice be provided to the Attorney General or prosecuting attorney, as appropriate, when the validity of a Kansas law is challenged on grounds that the law violates the state constitution, federal constitution, or federal law. All notices sent to the Attorney General are directed to the Solicitor Division for handling. Objective #1: Review and recommend for possible intervention or litigation or appellate support all Notices of Constitutional Challenges received by the OAG pursuant to KSA 75-764 and Supreme Court Rules 11.01, 147, and 148. B. KSA 75-764 requires that notice be provided to the Attorney General or prosecuting attorney, as appropriate, when the validity of a Kansas law is challenged on grounds that the law violates the state constitution, federal constitution, or federal law. All notices sent to the Attorney General are directed to the Solicitor Division for handling. Objective #2: When appropriate, file all necessary motions to intervene and required related pleadings in support of the constitutionality of Kansas laws under challenge in district or appellate courts. C. Support the traditional role of the Attorney General in providing the Governor advice about the legal sufficiency of extradition documents and when requested by the Governor, investigating demands made upon the Governor by the executive authorities of other states for the surrender of a person in this state who has been charged with a crime in another state. Objective #1: Provide legal assistance to the Governor of Kansas for extradition of fugitives who have taken asylum in Kansas and to county and district attorneys of other states when the State of Kansas is requesting the return of fugitives from justice. D. Build and sustain a team of appellate attorneys who can efficiently, effectively, and ethically represent the State of Kansas in criminal direct appeals and collateral appeals before state and federal appellate courts. KSA 75-702, KSA 75-703, K.S.A 75-764, and amendments thereto; KSA 60-1501, KSA 60-1507, 28 USC § 2241 et seq. and amendments thereto; Memorial Hospital Ass'n, Inc. v. Knutson, 239 Kan. 663, 667-68, 772 P.2d 1093 (1986). Objective #5: Provide for the defense of the State, its agencies and employees in collateral appeals and petitions for state habeas corpus relief filed pursuant to KSA 60-1501 and 1507 by individuals held in the custody of State institutions. Performance Measures
Solicitor's Division: CivilProgram HistoryCivil Appeals: In FY 2017 the new freestanding Solicitor Division was established with two Civil appeals attorneys
Consequences of Not Funding this ProgramOther programs would have to be discontinued to provide funding for this program. The state's legal interests may be unheard by cases in which the State is not a party. The state's legal and sovereign interests may be harmed by the unchallenged implementation of unlawful or unwarranted federal administrative rulemaking. The Sexually Violent Predator (SVP) unit of the Civil Division would need to be expanded to handle all the SVP appeals within the unit. Program GoalsA. Build and sustain a team of appellate attorneys that can efficiently, effectively, and ethically represent the State of Kansas in civil appeals before state and federal appellate courts. KSA 75-702 and 75-764. For civil appeals cases initiated by, retained, or referred to the Solicitor Division for action at the appellate court level, ensure that each and every action is handled professionally, competently, and ethically. B. Build and sustain a team of appellate attorneys that can efficiently, effectively, and ethically represent the State of Kansas in civil appeals before state and federal appellate courts. KSA 75-702 and 75-764. Objective # 2: Provide efficient, effective, and ethical legal advice concerning whether to join civil amicus curiae briefs, and when in the best interests of the State, draft civil amicus curiae briefs for cases before the United States Supreme Court or other appellate courts, and when advisable before trial courts. C. Build and sustain a team of appellate attorneys that can efficiently, effectively, and ethically represent the State of Kansas in civil appeals before state and federal appellate courts. KSA 75-702 and 75-764. Objective # 3: When in the best interests of the State, provide civil litigation support, including the handling of specialized litigation or the drafting of motions and dispositive pleadings. D. Build and sustain a team of appellate attorneys that can efficiently, effectively, and ethically represent the State of Kansas in civil appeals before state and federal appellate courts. KSA 75-702 and 75-764. Objective # 4: When in the best interests of the State, file petitions for review of federal administrative actions, including the drafting of motions, briefs, and presentation of oral argument. Performance Measures
Solicitor's Division: Contracted AppealsProgram HistoryContracted County Appeals: In 2014, the Attorney General was granted new statutory authority to allow the attorney general's office to enter into contracts with county and district attorneys to handle the appeals from locally prosecuted criminal cases. Commencing in FY 2015 the OAG began contracting with County and District Attorneys to handle their criminal appeals.
Performance Measures
Solicitor's Division: CriminalProgram HistoryCriminal Appeals: Starting with Fiscal Year 2017, the Criminal Appeals program was folded into the new freestanding Solicitor Division.
Consequences of Not Funding this ProgramFailure to respond to criminal appeals may result in the reversal of the underlying conviction to the detriment of public safety. A failure to file a responsive brief in an appeal of a habeas corpus petition may result in the release of the person imprisoned. A failure to participate in criminal appeals may result in the reversal of the underlying conviction to the detriment of public safety. A failure to respond to a habeas corpus petition may result in the release of the person imprisoned. A failure to respond to a habeas corpus petition may result in the release of the person imprisoned. A failure to respond to criminal appeals may result in the release of the reversal of the underlying conviction to the detriment of public safety. The state's legal interests may be unheard by cases in which the State is not a party. Program GoalsA. Build and sustain a team of appellate attorneys who can efficiently, effectively, and ethically represent the State of Kansas in criminal direct appeals and collateral appeals before state and federal appellate courts. KSA 75-702, KSA 75-703, K.S.A 75-764, and amendments thereto; KSA 60-1501, KSA 60-1507, 28 USC § 2241 et seq. and amendments thereto; Memorial Hospital Ass'n, Inc. v. Knutson, 239 Kan. 663, 667-68, 772 P.2d 1093 (1986). Objective #1: Utilize well-trained and resourced appellate attorneys to prepare and submit briefs to the Kansas Court of Appeals or Kansas Supreme Court, and argue relevant cases before these courts. B. Build and sustain a team of appellate attorneys who can efficiently, effectively, and ethically represent the State of Kansas in criminal direct appeals and collateral appeals before state and federal appellate courts. KSA 75-702, KSA 75-703, K.S.A 75-764, and amendments thereto; KSA 60-1501, KSA 60-1507, 28 USC § 2241 et seq. and amendments thereto; Memorial Hospital Ass'n, Inc. v. Knutson, 239 Kan. 663, 667-68, 772 P.2d 1093 (1986). Objective #2: Utilize well-trained and resourced appellate attorneys to represent the State in criminal proceedings before the United States Court of Appeals for the 10th Circuit. C. Build and sustain a team of appellate attorneys who can efficiently, effectively, and ethically represent the State of Kansas in criminal direct appeals and collateral appeals before state and federal appellate courts. KSA 75-702, KSA 75-703, K.S.A 75-764, and amendments thereto; KSA 60-1501, KSA 60-1507, 28 USC § 2241 et seq. and amendments thereto; Memorial Hospital Ass'n, Inc. v. Knutson, 239 Kan. 663, 667-68, 772 P.2d 1093 (1986). Objective #3: Utilize well-trained and resourced appellate attorneys to represent the State in criminal appeals proceedings before the Supreme Court of the United States. D. Build and sustain a team of appellate attorneys who can efficiently, effectively, and ethically represent the State of Kansas in criminal direct appeals and collateral appeals before state and federal appellate courts. KSA 75-702, KSA 75-703, K.S.A 75-764, and amendments thereto; KSA 60-1501, KSA 60-1507, 28 USC § 2241 et seq. and amendments thereto; Memorial Hospital Ass'n, Inc. v. Knutson, 239 Kan. 663, 667-68, 772 P.2d 1093 (1986). Objective #4: Provide for the defense of the State of Kansas, its agencies and employees in all petitions for federal habeas corpus relief filed pursuant to 28 USC § 2241 and 2254 by individuals held in the custody of State institutions. E. Build and sustain a team of appellate attorneys who can efficiently, effectively, and ethically represent the State of Kansas in criminal direct appeals and collateral appeals before state and federal appellate courts. KSA 75-702, KSA 75-703, K.S.A 75-764, and amendments thereto; KSA 60-1501, KSA 60-1507, 28 USC § 2241 et seq. and amendments thereto; Memorial Hospital Ass'n, Inc. v. Knutson, 239 Kan. 663, 667-68, 772 P.2d 1093 (1986). Objective #5: Provide for the defense of the State, its agencies and employees in collateral appeals and petitions for state habeas corpus relief filed pursuant to KSA 60-1501 and 1507 by individuals held in the custody of State institutions. F. Build and sustain a team of appellate attorneys who can efficiently, effectively, and ethically represent the State of Kansas in criminal direct appeals and collateral appeals before state and federal appellate courts. KSA 75-702, KSA 75-703, K.S.A 75-764, and amendments thereto; KSA 60-1501, KSA 60-1507, 28 USC § 2241 et seq. and amendments thereto; Memorial Hospital Ass'n, Inc. v. Knutson, 239 Kan. 663, 667-68, 772 P.2d 1093 (1986). Objective #6: Utilize well-trained and resourced appellate attorneys to provide efficient, effective, and ethical legal advice and assistance to county and district attorneys in appellate and other post-conviction practice before the state courts. G. Build and sustain a team of appellate attorneys who can efficiently, effectively, and ethically represent the State of Kansas in criminal direct appeals and collateral appeals before state and federal appellate courts. KSA 75-702, KSA 75-703, K.S.A 75-764, and amendments thereto; KSA 60-1501, KSA 60-1507, 28 USC § 2241 et seq. and amendments thereto; Memorial Hospital Ass'n, Inc. v. Knutson, 239 Kan. 663, 667-68, 772 P.2d 1093 (1986). Objective # 7: Provide efficient, effective, and ethical legal advice concerning whether to join criminal amicus curiae briefs, and when in the best interests of the State, draft criminal amicus curiae briefs for cases before the United States Supreme Court or other appellate courts, and when advisable before trial courts. Performance Measures
Special Litigation and Constitutional Issues DivisionPerformance Measures
Victim ServicesProgram HistoryThe Victims Services Division of the Office of the Attorney General was established in 2007 to improve the ability of this agency to meet the responsibilities given the statewide Victims' Rights Coordinator in 1989 (KSA 74-7337), and assure that victims are afforded their rights as noted in the Kansas Crime Victims Bill of Rights (KSA 74-7333). The ongoing statutory responsibilities assigned to the Victims' Rights Coordinator include to create, coordinate and assist in the operation of local victim-witness programs throughout the state; respond to a statewide victims' rights telephone hotline; and administer the Kansas crime victims' assistance fund. Victim-focused programs and initiatives were combined under this division for administration and coordination. This includes providing statewide coordination of crime victim and witness assistance programs; assisting in the development and implementation of statewide training curricula designed to promote best practice for crime victim response; providing direct assistance to crime victims and their families through the hotline and other contact; providing oversight, certification, and training for batterer intervention programs; administering state funded grants for victim service agencies; providing oversight and risk identification of child death trends and risk factors; coordinating statewide training, service delivery, and public awareness regarding human trafficking, providing coordination for the automated victim notification system in conjunction with county jails, coordination of the Safe At Home address confidentiality program; and coordination of youth suicide prevention efforts.
Consequences of Not Funding this ProgramThe OAG Victim Services division provides unique advocacy on behalf of all victims of crime by providing training and technical assistance to criminal justice professionals about prioritizing the importance of victims' rights, such as victim notification and informed participation in the criminal justice system. Additionally, victim services staff make nearly 2500 contacts each year with crime victims directly or on their behalf to meet their needs. Without funding, many victims of crime would not learn about their rights or learn of the resources that exist for their support. Within this program, the OAG VS division focuses on training and skill development for system based victim assistance staff (SBVAS) based in law enforcement agencies and County/District attorney offices. SBVAS serve a critical role with victims of crime as they navigate the criminal justice system and access resources in their community. Program GoalsA. To strengthen and enhance the quality of services to victims and witnesses of crime in all 105 counties of the state. KSA 74-7337; and amendments thereto; KSA 74-7337(c); KSA 74-7325 and amendments thereto; KSA 20-370; and KSA75-758. Objective #1: Improve local response to victims by providing technical assistance and resource material to local crime victim services and witness assistance programs in all counties of Kansas. B. To strengthen and enhance the quality of services to victims and witnesses of crime in all 105 counties of the state. KSA 74-7337; and amendments thereto; KSA 74-7337(c); KSA 74-7325 and amendments thereto; KSA 20-370; and KSA75-758. Objective #2: Ensure victims and witnesses receive appropriate assistance and referrals by responding to all requests for assistance from crime victims and witnesses of criminal conduct, and requests from all 105 Kansas counties and perform the functions of victim/witness coordinator for the office. C. To strengthen and enhance the quality of services to victims and witnesses of crime in all 105 counties of the state. KSA 74-7337; and amendments thereto; KSA 74-7337(c); KSA 74-7325 and amendments thereto; KSA 20-370; and KSA75-758. Objective # 3 To increase victim safety by ensuring that victims of crime and the general public have access to a timely and reliable automated victim notification program as per KSA 75-771. D. To strengthen and enhance the quality of services to victims and witnesses of crime in all 105 counties of the state. KSA 74-7337; and amendments thereto; KSA 74-7337(c); KSA 74-7325 and amendments thereto; KSA 20-370; and KSA75-758. Objective #5: Educate and inform the public and professionals working with crime victims to improve the response to victims throughout the state. KSA 74-7337 and amendments thereto; KSA 75-758. E. To reduce domestic violence in Kansas by ensuring domestic violence offenders have access to quality intervention services as provided by KSA 75-7d01 to 7d13. Objective #1: To increase domestic violence offender accountability and victim safety through a statewide certification program for batterer intervention programs (BIPs). F. To reduce domestic violence in Kansas by ensuring domestic violence offenders have access to quality intervention services as provided by KSA 75-7d01 to 7d13. Objective #2: The BIP Unit Coordinator will assist communities in the development of batterer intervention programs in underserved areas in Kansas. G. To coordinate and implement a statewide address confidentiality program for designated victims of crime that includes first class mail forwarding services at no cost to victims as outlined in KSA 75-451 through 75-458. Objective #1: To ensure the Kansas SaH program is appropriately and effectively implemented, including the efficient enrollment of safe at home participants and a timely first class mail forwarding system for those enroll. H. To coordinate and implement a statewide address confidentiality program for designated victims of crime that includes first class mail forwarding services at no cost to victims as outlined in KSA 75-451 through 75-458. Objective #2: Provide training, education, and technical assistance for SaH enrolling agencies and enrolling assistants. Performance Measures
Victim Services: Anti-Human TraffickingProgram HistoryIn 2010, The Attorney General's Office developed the Human Trafficking Advisory Board to improve the Kansas response to human trafficking, focusing on prevention, protection, prosecution, and partnership. This group worked to create awareness through training, and identified needs of the state to improve the response. In 2011, Anti-Human Trafficking Unit was developed in the Office of the Attorney General to provide the resources to coordinate and enhance the efforts to stop the commercial exploitation of children and other forms of human trafficking in Kansas as per K.S.A 75-756 to 75-759. The Unit continues to focus on providing education and training to professionals and the public on topics that promote a greater understanding of anti-trafficking practices.
Consequences of Not Funding this ProgramThere will be less capacity of criminal justice personnel statewide to respond effectively to human trafficking. There will be less coordination of training for law enforcement agencies throughout Kansas. Victim service agencies and allied professionals will not receive the necessary training for identification of human trafficking victims, and may not have the capacity to provide services to them. Less awareness of what human trafficking is and what it looks like in Kansas communities which could potentially lead to less reporting to law enforcement and a reduced number of victims recovered and criminals brought to justice. Loss of statewide coordination of policies to combat human trafficking that are mutually developed by state agencies, victim service groups and law enforcement. Program GoalsA. To coordinate and enhance the efforts to stop the commercial exploitation of children and other forms of human trafficking in Kansas as per KSA 75- 756 to 759. Objective #1: To enhance the human trafficking reduction efforts in Kansas through policy analysis by the Human Trafficking Advisory Board as per KSA 75-757. B. To coordinate and enhance the efforts to stop the commercial exploitation of children and other forms of human trafficking in Kansas as per KSA 75- 756 to 759. Objective #2: To increase the capacity of Kansas to reduce human trafficking through awareness efforts as per KSA 75-759. C. To coordinate and enhance the efforts to stop the commercial exploitation of children and other forms of human trafficking in Kansas as per KSA 75- 756 to 759. Objective #3: To increase capacity of criminal justice personnel statewide to respond effectively to human trafficking as per KSA 75-756. D. To coordinate and enhance the efforts to stop the commercial exploitation of children and other forms of human trafficking in Kansas as per KSA 75- 756 to 759. Objective # 4: To increase capacity of victim service agencies to respond effectively to human trafficking in Kansas as per KSA 75-758. Performance Measures
Victim Services: BIP ProgramPerformance Measures
Victim Services: Crime Victims CompensationProgram HistoryThis Division is responsible for supporting the Crime Victims Compensation Board (CVCB) to ensure that just compensation is awarded to victims of crime for economic loss from criminal conduct and in obtaining funds to satisfy victims' claims through the pursuit of subrogation rights, restitution, and fees from offenders. As part of this responsibility, the Division seeks to educate public officers and employees, health care providers, judges, attorneys, law enforcement officers, victims' advocates, and others about the board and the division. Our goal is to serve more victims of crime with empathy and efficiency. The Kansas Crime Victims Compensation program was established by the Legislature in 1978 (K.S.A 74-7301 to 74-7337).
Consequences of Not Funding this ProgramPer 34 U.S.C 20102, Federal VOCA Compensation Grants are a match award based on expenditures for Crime Victims Compensation. If state expenditures decrease, the Federal VOCA Grant Award decreases. Payments would have to be prioritized and some victim expenses would go unpaid. Victims would not receive referrals for additional services. Program GoalsA. To award just compensation to the victims of crime for economic loss arising from criminally injurious conduct. KSA 74-7302, et seq. Objective #1: The Executive Director will ensure that every claim is thoroughly investigated and that the monies awarded by the Board are properly distributed in a timely manner. B. To obtain additional funds to satisfy victim's claims through the pursuit of subrogation rights, restitution, and fees from offenders. KSA 74-7312, -7317(c), KSA 75-5211, -5268(e), Atty. Gen. Op. 90-65 and KAR 44-5-115(b). Objective #1: The Executive Director will ensure the Crime Victims Compensation Board receives funds to which it is entitled from subrogation rights, court ordered restitution and fees collected from offenders. C. To assist in the education of the public to improve methods of providing compensation to victims of crime. KSA 74-7304 (I), (j) and amendments thereto. Objective #1: The Executive Director, with the aid of the staff, will inform public officers and employees, health care providers, judges, attorneys, law enforcement officers, victim advocates, other interested groups and the public of the crime victim compensation program. D. To assist crime victims in connecting with resources beyond crime victims compensation. Objective #1: The Executive Director and the Division of Crime Victims Compensation staff will communicate with victims to help determine their needs and provide referrals outside of crime victim's compensation to assist victims in their recovery. Performance Measures
Victim Services: GrantsProgram HistoryThe grants program at the Attorney General's office was created in 1989 in conjunction with the passage of the crime victim bill of rights and the creation of the State Victim Rights coordinator role. With this, the legislature created the crime victim assistance fund (CVAF) in KSA 74-734 et seq. and transferred the responsibility of distributing the Protection From Abuse fund (created in 1984, KSA 74-7325 et seq) to the Office of the Attorney General. As years of have gone on and additional funds for serving victims of crime were created by the legislature, the distribution and monitoring of these grants were added to the responsibilities of the grant unit. This in includes: Child Exchange and Visitation funds (1996, K.S.A 74-7334 (e) and75-720), Child Advocacy Center funds (2004, K.S.A 20-370 and 74-7336) and Human Trafficking Victim Assistance fund (2013, K.S.A 75-58).
Consequences of Not Funding this ProgramThe CVAF grant is awarded to several types of agencies throughout the state of Kansas. Examples of the types of agencies receiving CVAF funding are: Child Advocacy Centers, CASA programs and Domestic Violence and Sexual Assault programs. Many of the grantees are dependent upon Victim Services grants to sustain the programming to victims listed above. If not funded, services to victims would be reduced significantly in the communities served by the grantee. Program GoalsA. To strengthen and enhance the quality of services to victims and witnesses of crime in all 105 counties of the state. KSA 74-7337; and amendments thereto; KSA 74-7337(c); KSA 74-7325 and amendments thereto; KSA 20-370; and KSA75-758. Objective #4: Improve the services available to victims statewide through the administration of crime victim assistance grant funds. KSA 74-7337; and amendments thereto; KSA 74-7337(c); KSA 74-7325 and amendments thereto; KSA 20-370; and K.S.A 75758. Performance Measures
Victim Services: Safe at Home ProgramPerformance Measures
Victim Services: VINE ProgramProgram HistoryIn 2015, the Kansas Department of Labor, the Kansas Sheriff's Association (KSA), and the Kansas Attorney General's Office collaborated for the successful implementation of Kansas VINE, the automated victim notification portion of this project. During the initial implementation phase, Kansas VINE completed activation in 80 county jails. In May 2019, the Kansas Department of Health and Environment (KDHE) became a contract holder joining the Kansas Department of Labor and the collaborative partners for the 2nd phase implementation of the remaining 16 county jails. Kansas victim advocates, law enforcement representatives, and concerned stakeholders have worked towards automated victim notification for over 20 years. Prior to the implementation of Kansas VINE, victim information and notification practices in Kansas were fragmented and varied in each jurisdiction. Notification to victims often relied on the voluntary practices of a local jail; or the prosecutor based Victim Witness Coordinator; or the few automated jail system notification programs. Kansas notification statutes do not address the time from the arrest of a suspect to the time when that suspect becomes a defendant charged with a crime. During the 2019 Legislative Session, KSA 75-771 provided for the creation of the Kansas VINE Coordinator within the Office of Attorney General and the establishment of the Kansas VINE Advisory Board. The Kansas VINE Advisory Board task is to provide the Attorney General recommendations regarding implementation and operation of Kansas VINE. Kansas Administrative Regulations 16-19-1, 16-19-2, and 16-19-3, which became effective on March 20, 2020, establish the Board. In 2021, Kansas VINE implementation was completed and is active in 96 county jails (8 KS counties do not have jail facilities and 1 did not implement VINE).
Consequences of Not Funding this ProgramPrior to the implementation of Kansas VINE, victim information and notification practices in Kansas were fragmented and varied in each jurisdiction. Notification to victims often relied on the voluntary practices of a local jail; or the prosecutor based Victim Witness Coordinator; or the few automated jail system notification programs. Without VINE, crime victims may not receive timely notifications of the release of the person who perpetrated against them from jail, and thefore could be in increased danger of re-offense, if not notfied and able to plan for their safety. Additionally, professionals, such as victim advocates, court services officers, law enforcement and others would not be able to sign up for notifications in order to better assist the crime victims they are serving. Program GoalsA. To increase victim safety by ensuring that victims of crime and the general public have access to a timely and reliable automated victim notification program as per KSA 75-771. Performance Measures
Youth Services: Child Death Review BoardProgram HistoryThe State Child Death Review Board was created by K.S.A 22a-243 in 1992 and is charged with reviewing all deaths of children ages birth through 17 years' old who die within Kansas and Kansas residents in that age group who die outside the state. The board works to identify patterns, trends, and risk factors and to determine the circumstances surrounding child fatalities. The ultimate goal is to reduce the number of child fatalities in the state by informing policies and practices that can save lives.
Consequences of Not Funding this ProgramThe Kansas State Child Death Review Board serves in the capacity as one of three Citizen Review Panels in the State. Each state is required by the Federal Child Abuse Prevention and Treatment Act (CAPTA) to establish citizen review panels in order to receive federal funding for child abuse prevention services. Program GoalsA. Conduct a review of all child deaths in Kansas pursuant to KSA 22a-243 and amendments thereto. Objective #1: Impact decision making in Kansas by collecting, maintaining, and reporting on data pertaining to child deaths. B. To provide guidance and information to advocacy groups, law enforcement agencies, and other related agencies in all 105 Kansas countiesregarding trends, risk factors, and patterns surrounding child death. KSA 22a-243(h) and amendments thereto. Objective #1: Serve on task forces and committees and attend meetings related to child death. Performance Measures
Youth Services: Drug Abuse Resistance Education (D.A.R.E.)Program HistoryThe statewide Drug Abuse Resistance Education (D.A.R.E.) program is housed within the Fraud and Abuse Litigation Division. The D.A.R.E. program was created in 1983 in Los Angeles. It was a partnership between the Los Angeles Police Department and the Los Angeles School District. The focus of the D.A.R.E. program is focused on drug abuse prevention as well as violence prevention. The curriculum has changed over the years to adapt to drug trends such as the rise of addiction to prescription medication and also crime trends such as school shootings or bullying. The way in which the D.A.R.E. program is taught has also changed, keeping up with research in curriculum and effective instruction techniques. In 1999, the Kansas legislature passed KSA 75-721 which required the Attorney General to appoint a statewide D.A.R.E. coordinator to assist local law enforcement agencies and schools in creation of local D.A.R.E. programs. The statewide coordinator is also required to provide training to local law enforcement in how to teach the D.A.R.E. curriculum. Finally, the statewide coordinator also must perform services and provide information as necessary to support the success of the D.A.R.E. program in Kansas.
Consequences of Not Funding this ProgramOfficers around the State will fail to receive necessary training for D.A.R.E. and SRO certification. Without this program relationships and coordination between the D.A.R.E. program and schools across the state would be weakened which would risk the effectiveness of the D.A.R.E. program in Kansas. Program GoalsA. To provide training and resources for Kansas school-based police (SBP) to reduce victimization of youth and help ensure a safer environment for the youth of Kansas. KSA 75-721 and amendments thereto. Objective #1: Provide trainings needed for D.A.R.E. and School Resource Officer (SRO) certification in Kansas along with collaborating with schools, communities, and other organizations to provide for the expansion of school based policing (SBP) programs in Kansas. Performance Measures
Youth Services: Youth Suicide PreventionProgram HistoryThe Youth Suicide Prevention unit was created in the OAG in 2019 by the KS legislature in KSA 75-772, in part due to the efforts of a task force that OAG created in 2018 to study the alarming trend of young people dying by suicide. The unit is charged with the following core responsibilities: lead the development, implementation and marketing of a website, online application and mobile phone application to facilitate communication with youth for the purpose of preventing youth suicide; develop and promote multidisciplinary and interagency strategies to help communities, schools, mental health professionals, medical professionals, law enforcement and others work together and coordinate efforts to prevent and address youth suicide; organize events that bring together youth, educators and community members from across the state to share information; and disseminate and promote information focused on suicide reduction to professionals and the public.
Consequences of Not Funding this ProgramThe YSP coordinator has been important to the development and promotion of multidisciplinary and interagency strategies statewide, to help communities, schools, mental health professionals, medical professionals, law enforcement and others work together and coordinate efforts to prevent and address youth suicide. This position was created at the OAG because the legislature noted a lack of coordinated efforts directed at addressing youth suicide specifically. If this were no longer funded, it would be necessary for other entities to pick up this responsibility and the focus on youth suicide may be lost in larger bureaucratic responses. Program GoalsA. The Kansas youth suicide prevention coordinator will work toward zero deaths by suicide of Kansas youth through the identification, creation, coordination, and support of youth suicide awareness and prevention efforts throughout the state as per KSA 75-772. Objective #1: To lead the development, implementation, and marketing of a website, online application and mobile phone application to facilitate communication with youth for the purpose of preventing youth suicide and promoting youth safety and wellbeing as per KSA 75-772. B. The Kansas youth suicide prevention coordinator will work toward zero deaths by suicide of Kansas youth through the identification, creation, coordination, and support of youth suicide awareness and prevention efforts throughout the state as per KSA 75-772. Objective #2: To develop and promote multidisciplinary and interagency strategies to help communities, schools, mental health professionals, medical professionals, law enforcement and others work together and coordinate efforts to prevent and address youth suicide as per KSA 75-772. C. The Kansas youth suicide prevention coordinator will work toward zero deaths by suicide of Kansas youth through the identification, creation, coordination, and support of youth suicide awareness and prevention efforts throughout the state as per KSA 75-772. Objective #3: To increase capacity of youth leadership in prevention of youth suicide as per KSA 75-772. D. The Kansas youth suicide prevention coordinator will work toward zero deaths by suicide of Kansas youth through the identification, creation, coordination, and support of youth suicide awareness and prevention efforts throughout the state as per KSA 75-772. Objective # 4: To increase capacity of service agencies to respond effectively to high risk youth as per KSA 75-772. Performance Measures
Behavioral Sciences Regulatory BoardInvestigation and DisciplineProgram HistoryThe BSRB was created by Kansas Legislature in 1980 by combining the previous Board of Psychology Examiners and the Board of Social Work Examiners. At the time of creation, one of the charges to the agency was to investigate complaints against practitioners.
Consequences of Not Funding this ProgramCitizens receiving services from practitioners who violate the statutes and regulations would not have a way to report misconduct. Practitioners who violate rules would be able to continue to practice. Program GoalsA. All complaints/Report of Alleged Violations (RAVs) from licensees and members of the public will be reviewed in a timely manner, a determination will be made whether the agency has jurisdiction to investigate the RAVs, and the agency will begin investigations in a timely manner. B. Investigative staff will attempt to maintain a short length of time from receipt of RAV to completion of investigation, when it is appropriate to end the investigation. C. Spend agency funding responsibly in the Investigation and Discipline program to effectively investigate RAVs, while avoiding unnecessary expenditures. Performance Measures
Licensing and RenewalsProgram HistoryThe BSRB was created by Kansas Legislature in 1980 by combining the previous Board of Psychology Examiners and the Board of Social Work Examiners. At the time of creation, one of the charges to the agency was to license practitioners. This role expanded over the years as other professions have come been added under the BSRB.
Consequences of Not Funding this ProgramPractitioners would not be able to be licensed to practice, which could result in individuals practicing without a violation or not practicing, leading to a sharp decrease in crucial services to the citizens of Kansas. Program GoalsA. Grant licensure to applicants who meet the statutory standards by reviewing applications in a timely manner, determining whether sufficient information has been provided to evaluate necessary criteria, and following up for additional information when necessary. B. Renew licenses for applicants who meet the statutory standards by reviewing materials in a timely manner, determining whether sufficient information has been provided to evaluate necessary criteria, and following up for additional information when necessary. C. Spend agency funding responsibly in the Licensing program to effectively process licensure requests while avoiding unnecessary expenditures. D. Develop and enhance internal and external relationships through effective communications with all stakeholders. Performance Measures
Board of AccountancyAdministrationProgram HistoryThe Board was initially created in 1915 with a "Board of Examiners" as a part of the Business Administration Department of the University of Kansas. Only three CPA certificates were issued that year. In its present form, the "Board of Accountancy" was created in 1952. In 1970, the Board became autonomous from the University and its offices moved to Topeka. A full-time Executive was hired to replace the part-time faculty CPA who had served as the official "Board Secretary" and the school of business clerical personnel who performed the duties of the Board. The new Executive was also designated as the official Board Secretary, as well as being the Executive Agency Head. In 1973, a Baccalaureate degree was a "concentration in accounting" defined by the Board, became the minimum requirement to take the national CPA exam to become a CPA. The Board was authorized to require continuing professional education as a requirement to renew or reinstate a permit to practice. In 2009, legislation was passed to allow out of state CPAs, without a physical presence in this State, to practice under mobility, without the need to obtain a certificate and permit.
Consequences of Not Funding this ProgramNot funding this program would result in the inability for persons to become certified public accountants in Kansas; further resulting in no oversight with compliance of the laws and regulations; and the public's inability to rely on financial reports issued solely by CPAs. Program GoalsA. To approve applications for certificates by exam and reciprocity to those who meet minimum qualifying requirements. B. To approve applications for permits to practice who meet an experience requirement and to reinstate permits to those who meet certain CE requirements. C. To register in-state and out-of-state CPA firms practicing in the state of Kansas. D. Enforcement: Regulate CPAs and the services provided relating to the practice of certified public accountancy. Performance Measures
Board of BarberingAdministrationProgram HistoryThe Kansas Board of Barbering as it is known today, was created by the Legislature on February 27, 1913. The original board consisted of three members which has since been increased to five members. In 1939, Kansas Statute Annotated (K. S. A.) 74-1805 set forth the Board's authority to adopt sanitary rules and regulations as deemed necessary to prevent the spreading of infectious or contagious diseases by means of infection control enforcement and education.
Consequences of Not Funding this ProgramThe Kansas Board of Barbering is a Fee Funded Agency. We do not use tax dollars or State funds, but we do pay 10% of all revenue to the State General Fund. Consequences of not funding this program would be there wouldn't be any oversight or licensing of barbers in Kansas. Program GoalsA. Respond promptly to emails and/or phone calls, processing applications, written requests, and mail received. B. Provide efficient testing for candidates to assess a candidates knowledge, skills, and ability to uphold infection control policies, safety procedures, and sanitation of barbering services C. Track and match all expenditures and revenue every month with the Smart Service Center/Department of Administration Finance via APPTIO. D. Inspections of Kansas barbers, barbering establishments, and barber schools and/or colleges. E. Number of inspections that find safety or sanitation violations of the KDHE barbering regulations; or find licensure violations. Performance Measures
Board of CosmetologyAdministrationProgram HistoryThe Board of Cosmetology was established by the 1927 Legislature to regulate the cosmetology industry. KBOC operates under the authority of KSA 65-1901 et seq. and KSA 74-2701 et seq. KSA 74-2701 established the creation, composition, and duties of the Board. KSA 74-2704 established the Cosmetology Fee Fund. The 1992 Legislature passed legislation (KSA 65-1920) to authorize the Board of Cosmetology to license and inspect tanning facilities. The 1996 Legislature passed HB 2916 (KSA 65-1940, et seq.), requiring the Board to develop and implement regulations for the tattooing and body piercing professionals in the State of Kansas.
Consequences of Not Funding this ProgramPrevention of the board to protect the health and safety of the consuming public by licensing qualified individuals and enforcing standards of practice. Program GoalsA. Safeguard the general public's health and safety through administration of policies and regulations. B. Regulate the cosmetology, tanning facility, and body art industries appropriately as required by law. C. Provide support to the regulated industries with informational tools necessary to meet the health and sanitation requirements determined by statute, rules, and regulations. Performance Measures
Board of Examiners in OptometryAdministrationProgram HistoryThe Board of Optometry was created in 1909. Three members constituted the Board. In 1909, approximately 70 licenses were held. The Board now has 5 Board members, 4 of which are licensed optometrists and one public member. 1977, qualified optometrists were allowed to utilze pharmaceutical agents for diagnosis. In 1987, qualified optometrists were permitted to treat certain eye diseases with topical (i.e., drops or ointments) pharmaceutical agents and remove embedded foreign bodies that do not penetrate into the eyeball. In 1996, qualified optometrists were permitted to treat Adult Open Angle Glaucoma. Other changes which this law effected include a requirement for minimum of $1,000,000 in professional liability insurance coverage. In 1999, therapeutic licensees were allowed to prescribe oral drugs for ocular conditions, some in consultation with an ophthalmologist. In 2005, licensees were required to obtain a therapeutic license by 2008 and a glaucoma license by 2010. In 2012, one level of licensure, require FBI background checks, require new graduates of optometry to have 24 hours of CE their first year, and established a litigation fund.
Consequences of Not Funding this ProgramOptometrists are the primary eye care providers for the citizens of Kansas. In addition to providing for the eye health of Kansans, optometric examinations detect underlying health conditions that may not be previously diagnosed, particularly heart disease, hypertension, and diabetes. Especially in more rural settings, optometrists are commonly the only option for eye care. Without licensing and enforcement of the statutes, rules and regulations of the Kansas Optometry Act, the citizens of Kansas would suffer from a lack of quality care necessary to protect both vision and systemic health. Program GoalsA. To license qualified optometrists. B. To investigate reports of infractions of the law and administer appropriate resolutions. Performance Measures
Board of Healing ArtsDisciplinaryProgram HistoryThe 1957 legislature created the State Board of Healing Arts. This act abolished three other state agencies (the Board of Medical Registration and Examination, the Board of Osteopathic Examination and Registration, and the Board of Chiropractic Examinations. The Board underwent many iterations over the many decades since it's inception adding many professions to it's current form where it now licenses and regulates 17 professions. In 1984, the legislature established the position of Disciplinary Counsel. This position was specified as required to be an attorney and was designed to deal with disciplinary matters. At this time, the Board was also authorized to hire one full-time investigator. The Board has grown from 5 staff in 1957 to it's current staff size of 61. Between 1957 and present many additional statutes and regulations have been added and/or amended to shape the practice of the Board today. The Board is a fully fee-funded agency that is a net contributor to the state general fund.
Consequences of Not Funding this ProgramKSA 65-2801 et.seq. gives the Board the authority to investigate and sanction those professionals licensed and regulated by the Board. The Disciplinary Department receives complaints and determines which ones meet the statutory requirements for an investigation. The Disciplinary Department is funded via the agency fee fund. If the agency ceased funding the Disciplinary Department, patients, hospitals, licensees and the general public would have nowhere to file a complaint when they felt a licensee was practicing outside their scope of practice or committed a boundary violation. This would leave patients and the general pubic unprotected from the unethical and below standard of care practice of medicine thereby putting people at risk of harm, injury or even death. Program GoalsA. Total number of investigations opened. B. Total number of complaints received. Performance Measures
LicensingProgram HistoryThe 1957 legislature created the State Board of Healing Arts. This act abolished three other state agencies (the Board of Medical Registration and Examination, the Board of Osteopathic Examination and Registration, and the Board of Chiropractic Examinations. The Board underwent many iterations over the many decades since it's inception adding many professions to it's current form where it now licenses and regulates 16 professions. The Board has grown from 5 staff in 1957 to it's current staff size of 61. Between 1957 and present many additional statutes and regulations have been added and/or amended to shape the practice of the Board today. The Board is a fully fee-funded agency that is a net contributor to the state general fund.
Consequences of Not Funding this ProgramKSA 65-2801 et. seq. authorizes the licensing of Healing Arts in Kansas. If healing arts and other medical professions were to be practiced in Kansas without licensure and regulation, the people of Kansas would be unprotected from untrained and possibly unethical people practicing in an unsafe or unprofessional manner. This would likely lead to serious injury, illness, death, and abusive practices against Kansas patients. Program GoalsA. Issue licenses within 10 days of final review. B. Total number of licenses issued. Performance Measures
LitigationProgram HistoryThe 1957 legislature created the State Board of Healing Arts. This act abolished three other state agencies (the Board of Medical Registration and Examination, the Board of Osteopathic Examination and Registration, and the Board of Chiropractic Examinations. The Board underwent many iterations over the many decades since it's inception adding many professions to it's current form where it now licenses and regulates 17 professions. The Board has grown from 5 staff in 1957 to it's current staff size of 61. Between 1957 and present many additional statutes and regulations have been added and/or amended to shape the practice of the Board today. The Board is a fully fee-funded agency that is a net contributor to the state general fund.
Consequences of Not Funding this ProgramKSA 65-2801 et.seq. gives the Board the authority to investigate and sanction those professionals licensed and regulated by the Board. The Disciplinary Department receives complaints and determines which ones meet the statutory requirements for an investigation. The Disciplinary Department is funded via the agency fee fund. If the agency ceased funding the Disciplinary Department, patients, hospitals, licensees and the general public would have nowhere to file a complaint when they felt a licensee was practicing outside their scope of practice or committed a boundary violation. This would leave patients and the general pubic unprotected from the unethical and below standard of care practice of medicine thereby putting people at risk of harm, injury or even death. Program GoalsA. Total investigations sent to litigation and opened as a case. Performance Measures
Board of Indigents Defense ServicesAdministrationProgram HistoryThe State Board of Indigents' Defense Services was created by the 1982 Legislature (1982 Session Laws, Ch. 142) for the purpose of providing indigent felony defense services as required by the Sixth Amendment to the United States Constitution.
Consequences of Not Funding this ProgramFailure to fund this program will render it impossible for the State of Kansas, through the Board of Indigents' Defense Services, to comply with its Sixth Amendment obligation to provide criminal defense services to all indigent Kansans who qualify for appointed felony counsel. The administrative office helps the Board accomplish this mission by providing support services for 17 public defender offices across the state, and administering the assigned counsel program with over 350 individual private counsel across all 31 judicial districts. Specifically,the administrative program accomplishes this by handling accounts payable and reciveable, purchasing, contract negotiations, information technology services, data collection and review, human resources services, training, budgeting, and through advocacy and responses to Legislative and public inquiries. Program GoalsA. Maintain statewide costs per case while maintaining quality service to clients. B. To monitor caseload and performance of public defenders in all divisions. C. To minimize increase in cost of expert services. Performance Measures
Appellate Defender ProgramProgram HistoryIn June 1985, the Board approved the development and implementation of the Appellate Defender Office as a statewide office to represent indigent felony defendants on appeal.
Consequences of Not Funding this ProgramFailure to fund this program will render it impossible for the State of Kansas, through the Board of Indigents' Defense Services, to comply with its Sixth Amendment obligation to provide criminal defense services to all indigent Kansans who qualify for appointed felony counsel. The appellate public defender program helps the Board accomplish this mission by providing quality efficient defense services at the Kansas Court of Appeals, Kansas Supreme Court, and the United States Supreme Court to indigent Kansans convicted of felonies who are appealing their convictions. Program GoalsA. To provide high quality and economically efficient constitutionally required defense services at the appellate level to our clients. B. To monitor caseloads of our public defenders to ensure compliance with professional ethical rules. Performance Measures
Assigned CounselProgram HistoryThe State Board of Indigents' Defense Services was created by the 1982 Legislature (1982 Session Laws, Ch. 142) for the purpose of providing indigent felony defense services as required by the Sixth Amendment to the United States Constitution.
Consequences of Not Funding this ProgramFailure to fund this program will render it impossible for the State of Kansas, through the Board of Indigents' Defense Services, to comply with its Sixth Amendment obligation to provide criminal defense services to all indigent Kansans who qualify for appointed felony counsel. The assigned counsel program helps the Board accomplish this by providing constitutionally required defense services in geographic areas where public defender offices do not yet exist or where the establishment of public defender offices is not cost efficient. Program GoalsA. Manage the average annual cost of assigned counsel expenditures while maintaining quality defense services. Performance Measures
Capital Defender ProgramProgram HistoryThe Board of Indigents' Defense Services established the Capital Defense Coordinator Office in FY1995 in response to the enactment of the death penalty. The Board transferred its most experienced attorney to the office and authorized a temporary Office Assistant I to assist. In FY1996 the office expanded and its name was changed to the Death Penalty Defense Unit to more accurately reflect its mission to defend potential death penalty cases statewide. The purpose of the office is to establish and administer procedures and to provide services that result in the highest quality defense of person's accused of murder when the potential penalty is death. To accomplish this purpose, the Death Penalty Defense Unit will (1) represent all individuals, except those with which the office has a conflict of interest, charged with potentially capital cases wherever charged in the state; (2) establish and administer a system by which courts may appoint qualified attorneys; (3) plan and execute training programs for staff, public defenders, private counsel, investigators, mitigation specialists and ancillary staff including continuing legal education programs, manuals and newsletters; (4) establish and maintain a resource library and consultation service for attorneys assigned to capital or potentially capital cases; (5) collect and maintain statistical records regarding the use of capital punishment; and (6) establish through contract and/or negotiation a system for providing trial counsel with competent and cost-effective expert and investigative services needed to defend potential capital cases. In FY2020, this office employed five trial attorneys, one investigator, two mitigators, two legal assistants and one clerical staff. Additional attorneys from trial offices are called upon to handle conflict cases on occasion.
Consequences of Not Funding this ProgramFailure to fund this program will render it impossible for the State of Kansas, through the Board of Indigents' Defense Services, to comply with its Sixth Amendment obligation to provide criminal defense services to all indigent Kansans who qualify for appointed felony counsel. The capital defender program helps the Board accomplish this mission by providing quality efficient capital defense services at the trial, appellate, and habeas level to indigent Kansans charged with capital crimes. Program GoalsA. To provide high quality and economically efficient constitutionally required defense services to our capital clients. B. To monitor caseloads of our public defenders to ensure compliance with professional ethical rules. Performance Measures
Legal Services for PrisonersProgram HistoryLegal Services for Prisoners, Inc. is a non-profit corporation organized under the laws of the State of Kansas for the purpose of providing legal assistance to indigent incarcerated residents of Kansas correctional institutions. KSA 22-4514(a) authorizes the corporation to submit its annual operating budget to the State Board of Indigents' Defense Services. BIDS has no administrative authority over LSP, rather LSP's budget is a passthrough and submitted as part of BIDS budget.
Consequences of Not Funding this ProgramLegal Services for Prisoners, Inc. is a non-profit corporation organized under the laws of the State of Kansas for the purpose of providing legal assistance to indigent incarcerated residents of Kansas correctional institutions. Failure to fund this program would prevent the State of Kansas from meeting its constitutional obligation to provide indigent incarcerated residents of KDOC with meaningful access to the courts to pursue non-frivolous legal claims. Program GoalsA. To provide individuals incarcerated in the Kansas Department of Corrections with constitutionally required meaningful access to the courts. B. To identify and assist those incarcerated residents with real legal problems concerning the validity of convictions and sentences, civil rights, and conditions of confinement. C. To discourage frivolous and unsubstantial litigation. D. To assist state courts and the Board of Indigents' Defense Services meet their program goals. E. To assist incarcerated residents in successfully completing their sentences, parole, and post release supervision. Those whose legal problems are taken care of prior to their release are more apt to successfully complete their term of parole or post release supervision. Performance Measures
Trial Public Defender ProgramProgram HistoryThe first two public defender offices (3rd Judicial District - Topeka, and 8th Judicial District - Junction City) were authorized and organized in FY 1972, and the third (28th Judicial District - Salina) was set up in FY 1973. The 18th Judicial District Public Defender Office (Wichita) was created in FY 1985, although it began its phase-in during the latter part of FY 1984. On July 3, 1989, the 10th Judicial District Public Defender Office (Johnson County) began accepting indigent felony appointments. The 25th Judicial District Office (Garden City) began accepting cases in January 1994. The 27th Judicial District Public Defender Office (Hutchinson) opened in June of 1996. The Johnson County Office opened a satellite office in Miami County in June of 1996. In August of 1996, the Garden City Office began accepting cases at a satellite office in Liberal, Kansas. The Northeast Kansas Conflict Office began accepting cases in July of 1997 and the Southeast Kansas Public Defender Office (Chanute) began accepting cases in August of 1997 and a satellite office was opened in 2005 in Independence. The satellite office in Miami County was closed that same year in favor of a contract to allow attorney FTE to devote full time to Johnson County. On July 1, 2008, the Sedgwick County Conflicts Office was opened in Wichita. Effective September 1, 2009, the Southwest Public Defender Office in Liberal was closed as a result of continuing staff turnover. In August 2021, the Board voted to request funding for FY 2023 to open a new public defender office in the 7th Judicial District, Douglas County.
Consequences of Not Funding this ProgramFailure to fund this program will render it impossible for the State of Kansas, through the Board of Indigents' Defense Services, to comply with its Sixth Amendment obligation to provide criminal defense services to all indigent Kansans who qualify for appointed felony counsel. The trial level public defender program helps the Board accomplish this mission by providing quality efficient trial level defense services to indigent Kansans charged with felonies in areas where the number of felony cases are numerous enough to justify maintaining a public defender office or in areas where there are an insufficient number of private attorneys to handel the number of criminal cases in their jurisdiction. Program GoalsA. Maintain statewide costs per case while maintaining quality service to clients. B. To monitor caseloads and performance of our public defenders for quality services. Performance Measures
Board of Mortuary ArtsAdministrationProgram HistoryThe Kansas State Board of Embalming has been in existence since May of 1907. The name was changed to the Kansas State Board of Mortuary Arts in 1985. The board operates under KSA 65-1701 et. seq. and KSA 74- 1701 et. seq.
Consequences of Not Funding this ProgramImproper disposition, failure to adhere to the wishes of the legal next-of-kin and taking advantage of consumers in a vulnerable situation. Program GoalsA. Ensure that all funeral homes, crematories, licensees, apprentices, and student embalmers operate according to state law. B. Ensure that all funeral homes, crematories, licensees, apprentices, and student embalmers operate to serve in the best interest of the consumer by meeting and maintaining licensing and regulatory requirements. C. Education and inform the public of their options when conducting business with licensees. Performance Measures
Board of NursingAdministrationProgram HistoryThe Kansas Board of Nursing was developed via the legislature in 1915 and has statutory authority to license nurses and licensed mental health technicians. The Board has statutory authority to approve the nursing education programs in Kansas. They also have statutory authority to investigative complaints received and present the investigative findings to the Board to determine if a violation of the Nurse Practice Act has occurred. If a violation has occured the Board can determine the discipline that should occur. KSA 74-1106 includes statutory authority for an eleven member board that constitutes a board of nursing, with the duties, power and authority set forth in the Nurse Practice Act. The Board has the authority to adopt rules and regulations consistent with the Nurse Practice Act. The Board has the authority to emply and executive administration and this staff member shall employ such other employees to carry on the work of the Board. The Board develops a strategic plan for a three year period that also helps to direct staff as to the priorities of the Board. Transparency regarding the activities and performance of the agency staff is important.
Consequences of Not Funding this ProgramThe Administrative Division oversees the administration of the agency. The Administrative division ensures the financial stability of the agency and identifies resources necessary for the agency to function and obtains those resources. The Administrator of the agency is the liason with the 11 member Board. The Administrative Division ensures the quarterly committee and board meetings occur seamlessly for the committee and board members The Administrator is responsible for legislative initiatives requested by the Board and submitting various required reports to the Legislature. If it was not funded, there would be no oversight of the entire agency. Program GoalsA. Provide a transparency report regarding the performance and activities of the Board and agency each fiscal year via an annual report that is posted on our website. B. Annual review with the Board regarding the agency performance regarding outcomes identified on the strategic plan developed by the Board. C. Update of the Nurse Practice Act when legislation is enacted that impacts nursing practice in Kansas or information updated. Performance Measures
DisciplineProgram HistoryKSA 65-1120 contains the grounds for disciplinary action against licensees that have a license with the Board of Nursing (authorized in 1949). It contains a provision that states the board may designate and authorize an employee or employees of the board to conduct an investigation on complains filed with the board. The board has authorized the RN Practice Specialist, RN Investigators and Special Investigator to conduct the investigations. After the investigation is completed, a summary of the findings are presented to the Investigative Committee, a sub committee of the board, that consists of three Board members. The Investigative Committee determines if there has been a violation of the Nurse Practice Act by the licensee based on the findings of the investigation. If the Investigative Committee (a sub committee of the Board) determines a violation has occurred, the case may be transferred to Disciplinary Counsel (an AAG assigned to the Board of Nursing) for further review and action.
Consequences of Not Funding this ProgramPublic protection would be jeopardized if licensees who violated the Nurse Practice Act were not disciplined. All complaints received in the office must be reviewed and a priority assigned. Anyone submitting a complaint to the Board of Nursing has the expectation that a thorough investigation will occur and the licensee will be disciplined if a violation occurred. Applicants with a legal history on their criminal background report must be reviewed to determine if it is safe to issue a license to the applicant. If the Investigative Committee (a sub committee of the Board) determines a violation has occurred, the case may be transferred to Disciplinary Counsel (an AAG assigned to the Board of Nursing) for further review and action. Program GoalsA. Discipline licensees who violate the Nurse Practice Act via initial orders, consent orders, evidentiary hearings, denied licenses, revoked licenses, limited and/or suspended licenses or diversion agreements. Performance Measures
EducationProgram HistoryThe authority to oversee the nursing programs in Kansas is in KSA 65-1119 (authorized in 1945). The authority to oversee the mental health technician programs is in KSA 65-4206 (authorized in 1973). Overseeing the programs includes reviewing faculty, curriculum and annual reports submitted by the program. Each program is surveyed every 5 - 10 years to verify the program is in compliance with our regulations for approval of the programs. The first-time licensure examination pass rates are monitored by the Board of Nursing and communicated to the Board and the programs. The Board of Nursing administers the mental health technician licensure examination. Education is provided to the program administrators. The authority to require continuing nursing education for our licensees is in KSA 65-1117 (authorized in1949) and 65-4205 (authorized in 1973). Annual reports and five-year renewal applications are received from the approved continuing nursing education providers. In the event a continuing nursing education provider wants to provide only one offering multiple times in a two year period, they apply for a single program provider. The authority for IV Therapy providers is in KSA 65-1136 (authorized in 1994). They must submit course rosters, faculty and annual reports that must reviewed. COVID travel restrictions have impacted the ability to do all the nursing program surveys per schedule and we were able to work with the nursing programs and change most to a virtual survey.
Consequences of Not Funding this ProgramPublic protection would be jeopardized if there were not licensure qualifications that all applicants must meet before a license was issued. The Board of Nursing checks applications to determine if the licensure qualifications have been met. Licensure is one component that helps establish competency of the nurse and mental health technician. Program GoalsA. Review and approve continuing education providers and programs that meet the Board's rules and regulations. B. Oversee the nursing programs, which includes surveying each nursing program once every 5 - 10 years. C. Receive an annual report from each nursing program by June 30, 2021 (as per regulation). D. Receive an annual report from each continuing education provider by July 31, 2021 (as per regulation). E. Ensure continuing nursing providers submit five-year renewals as per schedule. F. Review single nursing continuing education provider applications within 2 weeks of date received in agency. Performance Measures
InvestigativeProgram HistoryKSA 65-1120 contains the grounds for disciplinary action against licensees that have a license with the Board of Nursing (authorized in 1949). It contains a provision that states the board may designate and authorize an employee or employees of the board to conduct an investigation on complaints filed with the board. The board has authorized the RN Practice Specialist, RN Investigators and Special Investigator to conduct the investigations. After the investigation is completed, a summary of the findings are presented to the Investigative Committee, a sub committee of the board, that consists of three Board members. The Investigative Committee determines if there has been a violation of the Nurse Practice Act by the licensee based on the findings of the investigation.
Consequences of Not Funding this ProgramPublic protection would be jeopardized if complaints received in the agency were not investigated and icensees who violated the Nurse Practice Act were not disciplined. All complaints received in the office must be reviewed and a priority assigned. Anyone submitting a complaint to the Board of Nursing has the expectation that a thorough investigation will occur and the licensee will be disciplined if a violation occurred. Applicants with a legal history on their criminal background report must be reviewed to determine if it is safe to issue a license to the applicant. Program GoalsA. Review complaints received in the agency for possible violations of the Nurse Practice Act and assign a priority within 2 weeks of date received. B. Review applications with legal history before license is granted. C. Investigate possible violations of the nurse practice act in a timely manner and present to the Board. Performance Measures
LicensureProgram HistoryLicensure is required for all nurses (LPN, RN, APRN) and licensed mental health technicians to practice in Kansas. Authorization to practice is required for registered nurse anethetists to practice in Kansas. The licensure of professional nurses (RNs) is required by KSA 65-1115 (authorized in 1949). The licensure of practical nurses (LPNs) is required by KSA 65-1116 (authorized in 1949). The licensure of advanced practice registered nurses is required by KSA 65-1130 (authorized in 1983). The authorization for practice as a registered nurse anesthetist is required by KSA 65-1152 (authorized in 1986). The authorization for licensure of mental health technicians is KSA65- 4203 (authorized in 1973). This licensure program has always been with the Board of Nursing. Two major legislative changes have impacted the licensure program, the requirement of fingerprints for a criminal background report before licensure and the implementation of the Nurse Licensure Compact (NLC). KSA 74-1112 authorizes the Board of Nursing to require an applicant to be fingerprinted and submit to a state and national criminal history record check before being licensed to practice in Kansas. This was authorized in 2008. We performed the fingerprints in our agency until March 2020 at which time we stopped because of the COVID-19 pandemic as we were unable to social distance and obtain fingerprints. Since that time, the equipment outdated and would require the purchase of new, costly equipment. The applicants can obtain fingerprints at the KBI or most law enforcement agencies and then submit the fingerprints to us. This change also assisted to increase the efficiency of our licensing division in processing applications and responding to applicants. The Board of Nursing receives the fingerprint cards and waivers the applicants submit, processes them, and sends them to the KBI. We receive the criminal background report that is generated by the KBI and we process that report. The other major change for licensing was the implementation of the NLC on July 1, 2019. This change allowed LPN and RN applicants the option of another license type, a multistate license. This multistate license would allow the LPN or RN to work on this multistate license in another other jurisdiction that is part of the NLC (presently 37 other states and one U.S. terrirtory). This change was authorized in 2018 and implemented on July 1, 2019. This multistate license increases the mobility of the nurses with a multistate license. This license has proven to be very beneficial during the pandemic.
Consequences of Not Funding this ProgramPublic protection would be jeopardized if there were not licensure qualifications that all applicants must meet before a license was issued. The Board of Nursing checks applications to determine if the licensure qualifications have been met. Licensure is one component that helps establish competency of the nurse and mental health technician. Program GoalsA. Provide licenses and license renewals to eligible practical nurses, registered nurses, advanced practice registered nurses, registered nurse anesthetists, and mental health technicians. B. Issue a license to practice or authorization to practice within 3 business days after receipt of all required information 95% of the time. C. Enter information into the licensing software with 95% accuracy. Performance Measures
Operations ITProgram HistoryThe Operations/IT Division oversees the administration of the agency's 24 X 7 technology systems and eGovernment services, the agency's information security program, KSBN human resources, all agency procurements and the KSBN office facilities. The Board of Nursing is a highly automated agency that provides services to the KSBN Board and committee members, all internal staff and the 71,000+ licensed nurses of Kansas. KSBN was an early adopter of online technologies and was the first Kansas regulatory agency to fully automate online government services and verification technologies since the inception of eGovernment in the early 2000's. These systems interface with various educational and national entities. Over the past fifteen years, KSBN has processed over 500,000 applications, renewals, and reinstatements via our automated systems and increased the volume of licensed nurses, all while continuing to maintain near the same level of staffing within the agency. Our board has accomplished many of these goals by investing in advanced technologies and aggressively pushing towards further automation. These goals can only be accomplished by having updated technology offerings within our portfolio and maintaining competent and qualified staff within the board of nursing to produce these streamlined operations. The department's primary vision is to be "Citizen and Customer Focused - Technology Driven." The Operations/IT division ensures the operational stability of the agency technology resources, information security and human resources for the board of nursing.
Consequences of Not Funding this ProgramThe Operations/IT Division oversees the administration of the agency's technology systems and eGovernment services, the agency's information security program, KSBN human resources, all agency procurements and the KSBN office facilities. Not funding these critical areas of operations would severely impact all divisions within the agency and public protection would be jeopardized due to the unavailability of the 24 X 7 eGovernment service offerings. Program GoalsA. Maintain a superior and secure information technology infrastructure. B. Sustain electronic storage of records in the agency per agency record retention schedule. C. Annual review with the Board regarding the agency information security program posture and Continuity of Operations Plan (COOP) identified in the strategic plan developed by the Board. D. Recruit, develop and retain qualified staff and develop succession plans for key agency leadership positions. Performance Measures
Board of PharmacyDrug Monitoring
Consequences of Not Funding this ProgramMisuse abuse and diversion of controlled substances and drugs of concern Program GoalsA. Track prescriber, dispenser, and patient information for all scheduled substances and drugs of concern dispensed in Kansas or to an address in Kansas. B. Prevent abuse, misuse, and diversion of controlled substances and drugs of concern, while ensuring continued access for legitimate medical use. Performance Measures
RegulatoryProgram HistoryRegulation of the manufacture, sale, and distribution of drugs and poisons began in Kansas with the passage of enabling legislation in 1885. In the 1930s, sensational drug abuse cases contributed to the enactment of the Federal Food, Drug and Cosmetic Act by Congress. The dispensing of certain drugs was restricted by the Act to the pharmacist and only pursuant to a prescription. The Durham-Humphrey Amendment to the Act was enacted in 1951 distinguishing, at the federal level, those drugs requiring a prescription from nonprescription drugs or over-the-counter drugs. In addition to requiring a prescription for specific drugs, the Durham-Humphrey Amendment also provided provisions for the receipt of oral prescriptions as well as for the refilling of prescriptions.
Consequences of Not Funding this ProgramPotential for harm to the public resulting from: 1) No oversight of pharmacies and other drug facilities (registrants) administering, dispensing, or shipping drugs in Kansas, or pharmacy personnel (licensees). 2) Lack of compliance with pharmacy practice standards including sterile compounding. Program GoalsA. Licensing: Ensure that the practice of pharmacy protects the health, safety, and welfare of Kansas citizens and provide transparency to members of the public. B. Compliance: Facilitate compliance with, foster respect and appreciation for, and educate on Kansas statutes, rules, and regulation regarding the practice of pharmacy and proper manufacturing, distribution, and dispensing/sale of prescription and non-prescription drugs and devices for businesses and individuals doing business in the state of Kansas. Performance Measures
Board of Tax AppealsRegular Division: Exemption FilingsProgram HistoryEDX exemption is allowed pursuant to Kan. Const. art. XI, § 13.
Consequences of Not Funding this ProgramThe Board would be in non-compliance with Kansas Statutes. In addition, taxpayers would not avenue to appeal their taxes in front of a neutral body. Program GoalsA. Resolve disputes between taxpayers and taxing authorities promptly and impartially. B. Maintain public confidence in the state and local tax systems by providing sound leadership to enhance independent, efficient , professional decision-making, and certainty in state tax law. C. Continue to strive to meet the changing needs of our stakeholders. Performance Measures
Regular Division: Odds and EndsProgram HistoryPVs are filed with BOTA pursuant to KSA 74-2438. L. 1957, ch. 429, § 11. DTs are filed with BOTA pursuant to KSA 74-2438. L. 1957, ch. 429, § 11. NFWs are with BOTA pursuant to KSA 79-2938 (shortages in revenue). L. 1941, ch. 377, § 11 and filed with BOTA pursuant to KSA 79-2939 (unforeseen emergencies). L. 1941, ch. 377, § 12
Consequences of Not Funding this ProgramThe Board would be in non-compliance with Kansas Statutes. In addition, taxpayers would not avenue to appeal their taxes in front of a neutral body. Program GoalsA. Resolve disputes between taxpayers and taxing authorities promptly and impartially. B. Maintain public confidence in the state and local tax systems by providing sound leadership to enhance independent, efficient , professional decision-making, and certainty in state tax law. C. Continue to strive to meet the changing needs of our stakeholders. Performance Measures
Regular Division: Valuation AppealsProgram HistoryThe Board of Tax Appeals, or its equivalent, has been in existence since the late 1800s. Prior to 1929, the jurisdiction now conferred on the Board was placed in the Public Service Commission, the Inheritance Tax Commission, and other part-time bodies. In 1929, the Kansas Legislature created the State Tax Commission, consisting of three members. In 1939, the State Tax Commission was replaced by the State Commission of Revenue and Taxation. In 1957, the Director of Revenue and the Director of Property Valuation offices were severed from the Commission, and the Commission was replaced by a three-member Board of Tax Appeals. In 1969, the Board was increased to five members. In the 1975 legislative session, the Board of Tax Appeals was transferred out of the Department of Revenue and made an independent agency in the executive branch of state government. During the 1998 session, the Legislature created a Small Claims Division within the Board of Tax Appeals. In 2003, the Board was reduced from five members to three members. 2003 Kan. Sess. Laws, ch. 147 § 35.
Consequences of Not Funding this ProgramThe Board would be in non-compliance with Kansas Statutes. In addition, taxpayers would not avenue to appeal their taxes in front of a neutral body. Program GoalsA. Resolve disputes between taxpayers and taxing authorities promptly and impartially. B. Maintain public confidence in the state and local tax systems by providing sound leadership to enhance independent, efficient , professional decision-making, and certainty in state tax law. C. Continue to strive to meet the changing needs of our stakeholders. Performance Measures
Small ClaimsProgram HistoryEDX exemption is allowed pursuant to Kan. Const. art. XI, § 13.
Consequences of Not Funding this ProgramThe Board would be in non-compliance with Kansas Statutes. In addition, taxpayers would not avenue to appeal their taxes in front of a neutral body. Program GoalsA. Resolve disputes between taxpayers and taxing authorities promptly and impartially. B. Maintain public confidence in the state and local tax systems by providing sound leadership to enhance independent, efficient , professional decision-making, and certainty in state tax law. C. Continue to strive to meet the changing needs of our stakeholders. Performance Measures
Board of Technical ProfessionsAdministrationProgram HistoryIn 1976, KSA 74-7001 was established by the Legislature to create the Board of Technical Professions by combining the Engineering Examiners Registration Board (including Land Surveyors), the Architects Registration Board, and the Landscape Architects Registration Board. KSA 74-7004 provides that the purpose of the Board of Technical Professions is to establish and maintain a high standard of integrity, skills, and practice in the technical professions and to safguard the life, health, property and welfare of the public. The Board is authorized to collect licensing fees, renewal fees, and other fees as necessary to adminster provisions of KSA 74-7001 et. seq. In 1980, KSA 74-7036 was established by the Legislature outlining the practice of technical professions by a business entity, applications for certificate of authorizations, renewals, fees, and liability of services performed. In the 1997 Legislature, H.B. 2490 created the licensing of geologists starting July 1, 2000, by the Board of Technical Professions.
Consequences of Not Funding this ProgramIf this program was not funded there would be no regulation of professional individual and business licensure for Engineers, Architects, Surveyors, Landscape Architects, and Geologists. Program GoalsA. Ensure only qualified individuals become licensed as Architects, Engineers, Surveyors, Landscape Architects, and Geologists. B. Ensure all business entities obtain a certificate of authorization to legally practice a technical profession. C. Ensure only qualified persons and businesses continue to be licensed in Kansas by licensure renewals. Performance Measures
Board of Veterinary ExaminersInvestigation of ComplaintsProgram HistoryThe statute for practicing without a license was added in 1969. The statute relating to impaired veterinarians was added in 1989.
Consequences of Not Funding this ProgramNo oversight over reports of diseases communicable to humans, unsafe animal products entering the food chain, violations of certificates of veterinary inspection, negligent and fraudulent practices including unlicensed practice of veterinarians and practice by registered veterinary technicians, and practice of impaired veterinarians and veterinary technicians. Program GoalsA. Assure licensees practice in a manner which prevents and controls animal diseases communicable to humans, such as rabies. B. Assure licensees practice in a manner that protects the safety of animal products entering the food chain. C. Protection of the public welfare against negligent and fraudulent practices including unlicensed practice. D. Investigate all allegations of a licensed veterinarian's or registered veterinary technician's impairment. Performance Measures
Licensure, Registration, and RenewalsProgram HistoryLicensing of veterinarians started in 1907 with provisions in the Veterinary Practice Act (KSA 47-815 et seq.) Registration of veterinary technicians was implemented in 1993.
Consequences of Not Funding this ProgramA lack of uniformity in setting standards and not assuring the public that a veterinarian or registered veterinary technician possesses the qualifications, skills, and ability to practice their profession. Program GoalsA. To assure the public consumer that each licensed veterinarian and each registered veterinary technician is qualified, properly trained, and performing in accordance with the Kansas Veterinary Practice Act. B. To assure that all Kansas veterinary premises meet or exceed minimum premise standard to assure adequate facilities for providing veterinary services to the public in a sanitary and safe manner. C. To assure that licensees practice in a manner that prevents and controls animal diseases communicable to humans. D. To assure that licensees practice in a manner that protects the safety of animal products entering the public food chain. E. To protect public welfare against negligent and fraudulent practices, including unlicensed practice. F. To respond efficiently and effectively in the investigation of all allegations of violations reported to the agency. G. Insure that a mobile premise is a registered premise that has met certain standards and had a virtual inspection. Performance Measures
Premise InspectionsProgram HistoryRegulations for minimum standards for Veterinary Premises Sanitary Conditions and Physical Plant was implemented in 1994 and amended n 2017. While mobile premises were being identified in FY20, the first ones were registered in FY21.
Consequences of Not Funding this ProgramPremises and mobile premises would not meet minimum standards to assure adequate facilities for providing services to the public in a sanitary and safe manner. Program GoalsA. To have all Kansas veterinary premises in compliance with minimum standard regulations and registered with the Board. B. To register all "new" premises. C. To register all premises that change ownership. Performance Measures
Revision of Statutes and RegulationsProgram HistoryThe powers of the Board for KSA 47-821 (14) was passed in 1969.
Consequences of Not Funding this ProgramOutdated Statutes and Regulations as standards of practice. Program GoalsA. Development of Standards of Practice, Rules, and Regulation for approval by the board. Performance Measures
Citizens Utility Ratepayer BoardKansas Corporation Commission Rate CasesProgram HistoryCURB was funded by the Kansas legislature in 1991. The program/role of CURB as an advocate for residential and small commercial utility ratepayers has remained with the agency since that time. Since the enactment in 1991, there have been no legislative amendments to CURB's authority.
Consequences of Not Funding this ProgramThe effects of the pandemic on clients and DCF operations would be more severe. Program GoalsA. Represents CURB constituents in KCC rate cases. B. Intervenes in KCC cases where necessary to protect CURB constituents from unreasonable utility business practices. C. Represents CURB constituents before the Kansas legislature. D. Represents CURB constituents in complaint cases filed by with the KCC. Performance Measures
Legislative WorkProgram HistoryCURB was funded by the Kansas legislature in 1991. The program/role of CURB as an advocate for residential and small commercial utility ratepayers has remained with the agency since that time. Since the enactment in 1991, there have been no legislative amendments to CURB's authority.
Consequences of Not Funding this ProgramCURB's sole program responsibility and statutory authority centers on representation of residential and small commercial ratepayers before the KCC and the Kansas Legislature. These metrics indicate the key aspects of CURB's work; there are no separate and distinct programs that CURB offers its consumer citizens. The consequences of not funding CURB's program would be a void of respresentation of residential and small commercial ratepayers in important utility matters. CURB's respresentation of its contituents has obtained millions of dollars of utility rate savings as well as enjoined business practices sponsored by utilities that are adverse to consumer interests. For example, in Docket 18-WSEE-328-RTS, CURB opposed a minimum bill tariff and grid access charge for solar and other customers and prevailed before the KCC. This result benefited residential customers and may have been lost had CURB not intevene and sponsored testimony in the 2021 proceeding. CURB also attempts to add value to the legislative process through testimony before House and Senate utility committees. CURB also plays an integral role in advising consumers about their rights in utility complaint cases, both KCC-jurisdictional and otherwise. These benefits would be impared if this program were not funded. Program GoalsA. Represents CURB constituents in KCC rate cases. B. Intervenes in KCC cases where necessary to protect CURB constituents from unreasonable utility business practices. C. Represents CURB constituents before the Kansas legislature. D. Represents CURB constituents in complaint cases filed by with the KCC. Performance Measures
Other KCC CasesProgram HistoryCURB was funded by the Kansas legislature in 1991. The program/role of CURB as an advocate for residential and small commercial utility ratepayers has remained with the agency since that time. Since the enactment in 1991, there have been no legislative amendments to CURB's authority.
Consequences of Not Funding this ProgramCURB's sole program responsibility and statutory authority centers on representation of residential and small commercial ratepayers before the KCC and the Kansas Legislature. These metrics indicate the key aspects of CURB's work; there are no separate and distinct programs that CURB offers its consumer citizens. The consequences of not funding CURB's program would be a void of respresentation of residential and small commercial ratepayers in important utility matters. CURB's respresentation of its contituents has obtained millions of dollars of utility rate savings as well as enjoined business practices sponsored by utilities that are adverse to consumer interests. For example, in Docket 18-WSEE-328-RTS, CURB opposed a minimum bill tariff and grid access charge for solar and other customers and prevailed before the KCC. This result benefited residential customers and may have been lost had CURB not intevene and sponsored testimony in the 2021 proceeding. CURB also attempts to add value to the legislative process through testimony before House and Senate utility committees. CURB also plays an integral role in advising consumers about their rights in utility complaint cases, both KCC-jurisdictional and otherwise. These benefits would be impared if this program were not funded. Program GoalsA. Represents CURB constituents in KCC rate cases. B. Intervenes in KCC cases where necessary to protect CURB constituents from unreasonable utility business practices. C. Represents CURB constituents before the Kansas legislature. D. Represents CURB constituents in complaint cases filed by with the KCC. Performance Measures
Outreach WorkProgram HistoryCURB was funded by the Kansas legislature in 1991. The program/role of CURB as an advocate for residential and small commercial utility ratepayers has remained with the agency since that time. Since the enactment in 1991, there have been no legislative amendments to CURB's authority.
Consequences of Not Funding this ProgramCURB's sole program responsibility and statutory authority centers on representation of residential and small commercial ratepayers before the KCC and the Kansas Legislature. These metrics indicate the key aspects of CURB's work; there are no separate and distinct programs that CURB offers its consumer citizens. The consequences of not funding CURB's program would be a void of respresentation of residential and small commercial ratepayers in important utility matters. CURB's respresentation of its contituents has obtained millions of dollars of utility rate savings as well as enjoined business practices sponsored by utilities that are adverse to consumer interests. For example, in Docket 18-WSEE-328-RTS, CURB opposed a minimum bill tariff and grid access charge for solar and other customers and prevailed before the KCC. This result benefited residential customers and may have been lost had CURB not intevene and sponsored testimony in the 2021 proceeding. CURB also attempts to add value to the legislative process through testimony before House and Senate utility committees. CURB also plays an integral role in advising consumers about their rights in utility complaint cases, both KCC-jurisdictional and otherwise. These benefits would be impared if this program were not funded. Program GoalsA. Represents CURB constituents in KCC rate cases. B. Intervenes in KCC cases where necessary to protect CURB constituents from unreasonable utility business practices. C. Represents CURB constituents before the Kansas legislature. D. Represents CURB constituents in complaint cases filed by with the KCC. Performance Measures
Department of AdministrationDivision of BudgetProgram HistoryThe Kansas budget system was created by the 1917 Legislature. Major revisions of the original statutes occurred in 1925, 1953, 1972, 1978, and 1980. Current provisions are found in KSA 75 3714a et seq.
Consequences of Not Funding this ProgramThe State of Kansas would not have a central budget office to assist agencies in developing and implementing budgets, and strategic plans. The Governor would not have a professional non-partisan staff to aid in making budget decisions, track the proposed budget Program GoalsA. Perform comprehensive policy, management, and fiscal analysis. B. Produce an accurate budget reflecting the Governor's priorities. C. Balance state receipts and expenditures. D. To provide accurate budget and policy information in a timely manner. Performance Measures
Office Systems ManagementProgram HistoryThe Department of Administration was created by the Legislature in 1953. As part of the Department, the Office of Systems Management is tasked with providing technical, development and help desk support for the statewide Oracle/PeopleSoft Enterprise Resource Planning (ERP) system, including Financials Supply Chain Management (SMART) and Human Capital Management (SHARP) ERP used by all agencies. Current provisions are found in KSA 75-3701 et seq.
Consequences of Not Funding this ProgramThe Department of Administration serves as the core administrative backbone for state agency operations. DofA provides central oversight and management of various state government operations that are statutorily required. If this program is not funded these functions would cease to exist for the state and would have financial, regulatory, and legal implications for the state and state agencies. While some functions can be replicated in each state agency, the increased cost and loss of efficiencies would be extensive and impact overall state operations. Program GoalsA. Maintain or improve performance of the SHARP and SMART batch cycles and ensure uptime during business hours. B. Address and resolve programmatic abends, application defects, user enhancement requests & application updates. C. Identify, research and resolve agency user issues at both a Tier 1 and a Tier 1.5 level for the PeopleSoft ERP, including SMART, and SHARP, as well Employee Self Service, eSupplier, and Candidate Gateway (jobs portal). D. Safeguard end-user and application security of the SMART and SHARP systems. Performance Measures
Office of Accounts & ReportsProgram HistoryThe Department of Administration was created by the Legislature in 1953. The Departmentwas authorized to develop financial plans and policies; coordinate and supervise the fiscal affairs and procedures of the state; provide accounting, including budgetary accounting, fiscal reporting, pre-auditing. In 1965, the Department was reorganized and the Division of Accounts and reports was established. With various name changes and reorganization the current Office of Accounts and Reports (OAR) delivers the following external reports: State of Kansas Annual Comprehensive Financial Report (ACFR), Schedule of Expenditures of Federal Awards (SEFA) and related Statewide Annual Single Audit, Cash Management Improvement Act of 1990 (CMIA) Annual Report of excess interest earning on federal funds, Quarterly and annual reports to the United States Census Bureau and filing of federal 990T and Kansas K120 tax returns, and Issuance of annual W-2, 1099 and 1042-S forms
Consequences of Not Funding this ProgramThe Department of Administration serves as the core administrative backbone for state agency operations. DofA provides central oversight and management of various state government operations that are statutorily required. If this program is not funded these functions would cease to exist for the state and would have financial, regulatory, and legal implications for the state and state agencies. While some functions can be replicated in each state agency, the increased cost and loss of efficiencies would be extensive and impact overall state operations. Program GoalsA. To identify and implement solutions that support transparency to taxpayers and other interested groups. B. To provide appropriate guidance and support for minimized findings on external audits while ensuring compliance with statutory deadlines. C. Provide quality customer service to agencies, taxpayers and others served and supported through the KDRS/KTOP programs with the goal of maximizing collection of outstanding debt accounts for the State of Kansas, municipalities and foreign state agencies. D. Reduce the cost of printing and mailing by encouraging employees to opt for electronic W-2s and encouraging suppliers to receive payments by ACH. E. Ensure statutory, regulatory and accounting compliance for employment taxes through accurate, timely withholding and remittance for all required tax jurisdictions. Performance Measures
Office of Chief CounselProgram HistoryThe Department of Administration was created by the Legislature in 1953. As part of the Department, the Office of Chief Counsel manages the legal affairs of the Department of Administration and serves as the chief legal advisor to the Secretary of Administration, office directors and managers. The Office of Chief Counsel is responsible for all legal work arising from the activities of the Department and provides legal advice and services in a wide variety of areas of law, including legislation, finance, constitutional matters, commercial transactions, employment, real estate, litigation, contracts, and administrative regulations. Current provisions are found in KSA 75-3701, et seq.
Consequences of Not Funding this ProgramThe Department of Administration serves as the core administrative backbone for state agency operations. DofA provides central oversight and management of various state government operations that are statutorily required. If this program is not funded these functions would cease to exist for the state and would have financial, regulatory, and legal implications for the state and state agencies. While some functions can be replicated in each state agency, the increased cost and loss of efficiencies would be extensive and impact overall state operations. Program GoalsA. Provide departmental offices and customer agencies with timely preparation and review of requested agreements, opinions, policies, procedures and other items requiring the services of counsel. B. Provide state agency and other governmental attorneys with relevant, cost-effective continuing legal education (CLE) and training opportunities. C. Provide agencies with cost-effective means to prepare and obtain required departmental approval of regulations. Performance Measures
Office of Facilities and Property ManagementProgram HistoryThe Division of Facilities Management (DFM) was created as a result of a reorganization of the Department of Administration in March 1989 to facilitate the statutory duties of the Secretary of Administration. KSA 75-3762 grants the Secretary of Administration the "...charge, care, management and control of the Statehouse, the state office buildings, the Kansas Technical Institute...the office building at 801 Harrison [in Topeka], the Memorial Hall, the Governor's mansion, [the Landon State Office Building] and all other buildings or grounds now or hereafter owned or to be owned by the state in Shawnee County, the custody of which buildings or grounds is not assigned by law to some other state agency."In January 2002, The Division of Architectural Services merged with the Division of Facilities Management. During FY 2012, the Office of Facilities and Procurement Management was created as part of a functional re-structuring of the Department. In FY 2015, the Office of Procurement and Contracts was separated from the Office of Facilities and Procurement Management, resulting in returning the name back to the Office of Facilities and Property Management.
Consequences of Not Funding this ProgramThe Department of Administration serves as the core administrative backbone for state agency operations. DofA provides central oversight and management of various state government operations that are statutorily required. If this program is not funded these functions would cease to exist for the state and would have financial, regulatory, and legal implications for the state and state agencies. While some functions can be replicated in each state agency, the increased cost and loss of efficiencies would be extensive and impact overall state operations. Program GoalsA. Respond to all tenant building maintenance, un-scheduled cleanups and emergency services in an efficient manner (including mechanical, electrical and plumbing systems) in the Capitol Complex, Forbes and Cedar Crest. B. Efficiently provide quality housekeeping services to Capitol Complex buildings, Forbes and leased buildings, Zibell, Scott, Mills and State Defense Building. In addition, complete Statehouse and Statehouse Grounds event setup and tear down as required. C. Track number of actions processed for project code review, bid posting, administration by Planning and Administration staff. Performance Measures
Office of Financial ManagementProgram HistoryThe Department of Administration was created by the Legislature in 1953. As part of the Department, the Office of Financial Management was established during FY 2013 as part of the Department of Administration's reorganization. The three primary functions of the Office of Financial Management include the following: 1) DofA Accounting Services; 2) DofA Budgeting; and 3) Non-Cabinet Agency Service Center. General duties include consulting, supporting and assisting in monitoring and improving the financial health of the Agency, along with administering the security of the SMART system for Agency processors, paying the debt service for the State, and compiling the necessary data for SWCAP (Statewide Cost Allocation Plan).
Consequences of Not Funding this ProgramThe Department of Administration serves as the core administrative backbone for state agency operations. DofA provides central oversight and management of various state government operations that are statutorily required. If this program is not funded these functions would cease to exist for the state and would have financial, regulatory, and legal implications for the state and state agencies. While some functions can be replicated in each state agency, the increased cost and loss of efficiencies would be extensive and impact overall state operations. Program GoalsA. Provide accounting and fiscal management services to the Department of Administration and other state agencies. B. Provide timely services for our agency and to our customers. Performance Measures
Office of Personnel ServicesProgram HistoryThe Department of Administration was created by the Legislature in 1953. The Departmentwas authorized to administer all personnel matters. In 1965, the Department was reorganized and the Division of Personnel was created. Through various name changes and reorganizations, the currentthe Office of Personnel Services (OPS) administers the Kansas Civil Service Act and other related statutes to provide a comprehensive human resource (HR) program for the State of Kansas. In 2011, Executive Order 11-04 directed that all non-Regents HR staff in agencies under the Governor's jurisdiction report to the Director of Personnel Services and also that OPS is to establish and implement consistent HR policies, procedures and practices for the State workforce.
Consequences of Not Funding this ProgramThe Department of Administration serves as the core administrative backbone for state agency operations. DofA provides central oversight and management of various state government operations that are statutorily required. If this program is not funded these functions would cease to exist for the state and would have financial, regulatory, and legal implications for the state and state agencies. While some functions can be replicated in each state agency, the increased cost and loss of efficiencies would be extensive and impact overall state operations. Program GoalsA. Provide quality services and information that meets the HR needs of customer agencies. B. Reduce the amount of time that it takes for agencies to fill both classified and unclassified positions. C. Provide enhanced and expanded training and staff development opportunities for State employees. Performance Measures
Office of Printing, Central Mail and SurplusProgram HistoryThe Office of Printing, Surplus and Central Mail provides printing, copying, binding, fulfillment and mail services for state agencies and operates the Surplus Property program. KSA 75-1005 grants the State Printer to do all the printing and binding required by the legislature, the supreme courts, the governor or any state agency.75-1001a established the Division of Printing, transferring all the functions of the elected State Printer to the Director of Printing. KSA 75-4512 allows the Secretary of Administration to provide and maintain central and consolidated mail services for state agencies. KSA 75-6601 et seq. establishes the State Surplus program. In July 2004, the Surplus Programs were transferred from the Department of Corrections to the Department of Administration and in May 2007 the Surplus Property programs were merged with the Division of Printing. Surplus Property has (4) four programs:Federal Surplus, State Surplus, LESO/1033 and Fixed Price Vehicles Sales. In 2017, adjustments to the organization were made. Printing, Central Mail and Surplus became a separate office.
Consequences of Not Funding this ProgramThe Department of Administration serves as the core administrative backbone for state agency operations. DofA provides central oversight and management of various state government operations that are statutorily required. If this program is not funded these functions would cease to exist for the state and would have financial, regulatory, and legal implications for the state and state agencies. While some functions can be replicated in each state agency, the increased cost and loss of efficiencies would be extensive and impact overall state operations. Program GoalsA. Excel and increase the number of digital impressions to our agencies, producing a quality product that is cost-effective and delivered on time. B. Increase state agency surplus reimbursements. C. Increase number of donees and sales of surplus property. D. Increase pieces of mail processed and promote convenient, cost effective mail services to state agencies to maximize volume capacity. Performance Measures
Office of Procurement ContractsProgram HistoryKansas statutes provide authority and guidance to OPC for the procurement of goods and services. A Division of Purchases was originally established in 1953 under the Department of Administration (KSA 75-3737a to 75-3744).In 1987, the Legislature provided specific authorization to use negotiated procurement as a source selection method for the acquisition of technical equipment and services, with the Director of Purchases as a statutory member of the procurement negotiating committee (KSA 75-37,102, as amended).The 2000 Legislature established the Professional Services Sunshine Act. This Act, KSA 75-37.130 et seq., requires competitive contracts for professional and consulting services exceeding $25,000 to be bid by the Office of Procurement and Contracts, formerly the Division of Purchases, which do not meet the requirements of KSA 75-3739 (a) and (h).In accordance with state statute, the Office of Procurement and Contracts posts all potential sole source transactions in the amount of $100,000, or greater, to its website for seven days prior to award, allowing potential competitors an opportunity to challenge the sole source nature of the transaction.
Consequences of Not Funding this ProgramThe Department of Administration serves as the core administrative backbone for state agency operations. DofA provides central oversight and management of various state government operations that are statutorily required. If this program is not funded these functions would cease to exist for the state and would have financial, regulatory, and legal implications for the state and state agencies. While some functions can be replicated in each state agency, the loss of subject matter expertise in state procurement processes, increased cost and loss of efficiencies would be extensive and impact overall state operations. Program GoalsA. To provide information on the amount of procurement activity generated through the Office of Procurement and Contracts. All purchase requisitions generated by state agencies through SMART require some level of review and action. B. Minimize the number of non-competitive bid requests approved. C. Maximize the number of state contracts that are managed in a fiscal year by the Office of Procurement and Contracts. D. Maximize the number of statewide contracts available to political subdivisions within the state. E. Implement strategic sourcing of state contracts for goods and services when practicable. Performance Measures
Office of Public Advocates: KanCare OmbudsmanProgram HistoryKanCare was started as a new managed care medicad services program in January 2013. When KanCare was created, the KanCare Ombudsman was included in the program per CMS special terms and conditions. The KanCare Ombudsma Office has been included in each of the subsequent renewals that have taken place.
Consequences of Not Funding this ProgramFailure to fund this office would be in violation the Centers for Medicare and Medicaid (CMS) Special Terms and Conditions for KanCare. KanCare/Kansas Medicaid has over 500,000 members. The KanCare Ombusdman Office is available to assist any of the members, applicants,family and other stakeholders with issues they may be experincing with KanCare/Kanss Medicaid. Not funding this program would create issues with CMS in regard to the KanCare program and not meeting their requirements. Program GoalsA. Through advocacy, education, and resource, the KanCare Ombudsman Office assists members, applicants and other stakeholders to navigate and access the application process and covered health care services and supports. Performance Measures
Office of Public Advocates: Long Term Care OmbudsmanProgram HistoryThe Older Americans Act (42-USC 3001 et seq.) mandates that each state establish and operate an Office of the State Long-Term Care Ombudsman to provide services to protect the health, safety, welfare and rights of residents. KSA 75-5916 through 75-5922, enacted in 1980, establishes the Long-Term Care Ombudsman Program. The Omnibus Reconciliation Act of 1987 and amendments thereto have further defined the role of the Ombudsman. Public Law 160-175, the 1987 amendments of the Older American Act, authorized Title III Part G grants to states to prevent abuse, neglect, and exploitation of older individuals. The 1987 amendments also provide that adequate legal counsel is available to the ombudsman office and that legal representation is provided to representatives of the office to ensure that the ombudsman has the ability to pursue administrative, legal and other appropriate remedies on behalf of the facility residents. The Older Americans Act of 1998 amendments funded the program under Title VII, Section 702(b). The Older Americans Act Reauthorization Act of 2016 authorizes LTC Ombudsman programs to serve residents transitioning from a LTC facility to a home-care setting, when feasible, and serve all LTC facility residents regardless of their age.
Consequences of Not Funding this ProgramFailure to fund this program would be a violation of the Older Americans Act of 1965, which requires an Office of the State Long-Term Care and Ombudsman in every state. Programs associated with the Older Americans Act serve over 300,000 Kansans. By not funding the program, the State of Kansas would lose federal funding in excess of $400,000 annually and Kansans would not have access to an ombudsman to investigate and resolve complaints. Program GoalsA. Through advocacy, self-empowerment and education by the Long-Term Care Ombudsman Program each resident in a Kansas long-term care facility will be treated with dignity and respect and will have his/her rights honored. Performance Measures
Office of the State Employee Health Benefits PlanProgram HistoryIn the 2020 legislative session, Executive Reorganization Order No. 45 transferred the functions of the State Employees' Health Benefits Program (SEHBP) and the State Workers Compensation Self-insurance Fund from the Department of Health and Environment to the Office of the State Employees' Health Benefits Program (SEHBP) within the Department of Administration. SEHBP was established as a separate office in the Department of Administration. The State Employees' Health Benefits Plan (SEHBP) program administers the State Employee Health Plan (SEHP) on behalf of the Health Care Commission (HCC).The SEHBP was transferred to the Division of Health Policy and Finance in 2005, consolidated into Kansas Health Policy Authority in 2006, merged with Kansas Department of Health and Environment on July 1, 2011 and merged with the Department of Administration July 1, 2020. Statute (KSA 75-6501 et seq.) provides for an Employee Advisory Committee which was implemented in 1995. That committee consists of 21 members: 18 active employees and three retirees serving three-year rolling terms. The Employee Advisory Committee meets quarterly and provides input to staff on the health plan administration. The Workers' Compensation Program for State employees is called the State Self-Insurance Fund (SSIF). The SSIF was implemented through legislation in 1974 and consolidated into the Division of Personnel Services in 1988. The SSIF was transferred to the Division of Health Policy and Finance in 2005, consolidated into Kansas Health Policy Authority in 2006, merged with Kansas Department of Health and Environment on July 1, 2011 and merged with the Department of Administration July 1, 2020. It is a self-insured, self-administered program and administered by 16 staff members. The SSIF is funded by agencies based on an experience rating. The agency rates are developed by an actuarial service using claims experience, payroll history and caps on expenses. Rates are currently approved by the Department of Administration and published by the Division of Budget.
Consequences of Not Funding this ProgramThe Department of Administration serves as the core administrative backbone for state agency operations. DofA provides central oversight and management of various state government operations that are statutorily required. If this program is not funded these functions would cease to exist for the state and would have financial, regulatory, and legal implications for the state and state agencies. While some functions can be replicated in each state agency, the increased cost and loss of efficiencies would be extensive and impact overall state operations. Program GoalsA. Manage the fund balance to be 10%-13% of Plan Expenses over the preceding three years (HB 2218). B. Improve the health of members of the plan. C. Integrate the Nurse Triage Program to reduce claim expense in State Self-Insurance Fund. Performance Measures
Department of CommerceAmerica's Job Link AllianceProgram HistoryAmerica's Job Link Alliance-Technical Support (AJLA-TS) is now in its 53rd year of providing data processing systems, training, and technical support to workforce development agencies. AJLA-TS was first organized as the Manpower and Computer Systems Institute (MACSI) in 1969 through federal grants. AJLA-TS has also operated under the name Employment Security Systems Institute (ESSI) and America's Workforce Technology Solutions (AWTS). AJLA-TS has been a producer of web-based systems since 1999.
Consequences of Not Funding this ProgramAJLA-Technical Services (AJLA-TS) is an asset to the State of Kansas as a provider of workforce services to states across the nation. Nine states utilize America's JobLink (AJL), our web-based, all-in-one labor exchange and case management solution for user-centered workforce development organizations. AJLA-TS staff are fully versed in the AJL system functions needed to support workforce development activities including job seeker services, employer services, partner services, fiscal management services, and federal reporting services, including reporting and data validation requirements. The JobLink Mobile app complements AJL as a free, user-friendly app for job seekers. Job seekers can view, save, and share jobs from across the state. The Work Opportunity Tax Credit (WOTC) is a federal tax credit available to employers who hire individuals from eligible target groups with significant barriers to employment. The AJLA CertLink online system allows employers and employer consultants to apply for and manage WOTC applications and certifications and allows state workforce agencies and other participating agencies to administer the WOTC program. Four states utilize CertLink. VOCAL, or vocational portal, is an online service delivery hub. It provides a "no wrong door" approach for customers to explore a variety of re-employment and training resources, as well as connect with front-line staff and career counselors through email, chat, and calendar features. It also provides light-weight case management for staff, including referrals and other features that support partner collaboration for enhanced service delivery. Two states utilize VOCAL. VOCAL will sunset within the next year and its functionality incorporated into America's JobLink. Without AJLA-TS, the state would be unable to meet contractual obligations in place for nine states across four different applications. Failure to provide these duties could result in states and their local workforce investment areas being sanctioned both monetarily and operationally for non-compliance with federally mandated data collection and reporting requirements. Program GoalsA. Increase revenue by 10%. B. Improve website user experience. Performance Measures
Athletic CommissionProgram HistoryThe Athletic Commission was created by the 2004 Legislature to promote and regulate the state's combat sports industry. In recent years, the combat sports industry in Kansas has seen an increase in the interest and number of mixed martial arts and professional wrestling contests.
Consequences of Not Funding this ProgramThe Athletic Commission promotes and regulates the state's combat sports industry in line with accepted industry standards. The Commission works to facilitate high quality combative sporting events, while striving to protect the health and welfare of all participants and spectators. If the Commission was not funded and fights continued, the state would be exposed to litigation if a fighter were to be seriously hurt without the most current regulations in place. In addition, the great athletes of Kansas would not have an opportunity to compete in front of friends and family and bring much needed revenue to the state. Program GoalsA. Regulate and facilitate high quality competitive sporting events, while striving to protect the health and welfare of all participants and spectators. B. Increase number of licenses issued to participants and officials by expanding the industry across Kansas. C. Ensure the Kansas judges and referees are certified by the Association of Boxing Commissions (ABC) in order to enhance the integrity and safety of all regulated sports in the state. Performance Measures
Broadband DevelopmentProgram HistoryKDC was designated as the lead state agency for broadband development in 2010 as part of the NTIA's 5 year broadband mapping and capacity building grant program. Since then, KDC has continued to accelerate economic growth in Kansas by harnessing broadband internet access for all citizens and communities. In 2020, as part of the KDOT IKE Transportation bill, KDC received $85 million over 10 years to establish and implement an infrastructure grant program to accelerate deployments where there is demonstrated need. Subsequently, KDC established and implemented the state's broadband pandemic response plan and Governor Kelly formally established the Office of Broadband Development within KDC to serve as the primary coordinating agency for the state. KDC is currently administering the second year of the 10-year Broadband Acceleration Grant program funded by the IKE Transportation Plan. OBD continues to work with local communities, ISPs and federal funding partners to carry out it's mission to ensure all Kansans have access to robust broadband services.
Consequences of Not Funding this ProgramWithout funding for this program the state will not have a sustainable approach to expanding robust broadband connectivity throughout the state and many rural communities will go without reliable internet access. New federal funding opportunities will be at risk as they are increasingly linked to being a part of the state's coordinating broadband office. Program GoalsA. Award infrastructure grants to expand broadband availability to premises where needed. B. Provide local and regional communities with technical assistance and support to identify priority needs and increase adoption of broadband services to enhance overall economic growth. C. Facilitate federal broadband funding investments in Kansas. Performance Measures
Business DevelopmentProgram HistoryThe Business Development Division grows the Kansas Economy through the creation and retention of jobs and increased capital investment. This Division is charged with recruiting new business and assisting existing Kansas companies interested in opportunities to grow and expand in the state. In 2020, Governor Kelly announced that Kansas broke the record for new capital investment in the state - over $2.5 billion was invested by private businesses, the highest total in the 35-year history of the Department of Commerce. In 2021, Kansas again broke the capital investment record with more than $3.8 billion invested by private businesses. Calendar year 2022 is expected to result in a third year of record-breaking capital investment. For the past 3 years, Kansas has seen record breaking capital investment. In 2020, Kansas had over $2.5 billion in capital investment; in 2021, Kansas saw $3.8 billion in capital investment; and in 2022, Kansas broke the record again with nearly $7.4 billion in capital investment. 2023 is expected to be another record breaking year.
Consequences of Not Funding this ProgramThe division plays a critical role connecting companies, both new and expanding, with the resources needed to stay and grow in the state. Without funding, there will be limited interaction between companies and the state thereby limiting the opportunities to help companies capitalize on potential new projects. The states we often compete with for jobs and capital investment have well-funded public or public-private partnerships to aggressively recruit new business. Loss of funding would make it difficult for the state of Kansas to compete for this new business. Program GoalsA. Increase new business to Kansas. B. Retain businesses in Kansas. Performance Measures
Business Development: HPIPProgram HistoryThe Kansas High Performance Incentive Program (HPIP), signed into law by Governor Finney in 1993, offers significant and comprehensive business incentives to encourage the construction and expansion of Kansas businesses and industries. Specifically, the High Performance Incentive Program (HPIP) offers business incentives to companies that make new capital investment in their companies and pay above-average wages for their industry. During the 2020 legislative session, Senate Bill 65 was signed into law by Governor Kelly. This bill decoupled the Kansas Industrial Training and Kansas Industrial Retraining grants from the program and added the ability for an HPIP qualified company to transfer tax credits to another entity or individual.
Consequences of Not Funding this ProgramHigh Performance Incentive Program (HPIP) is an incentive program that can provide generous tax benefits to businesses that in return are willing to expand the scope of their capital investments, pay a higher than average wage and make a significant investment in employee training. A lack of funding would result in the loss of jobs and new capital investment by eligible companies in Kansas. Program GoalsA. To increase wages and economic development. B. To encourage eligible companies to increase capital investment. Performance Measures
Business Development: Job Creation FundProgram HistoryThe Job Creation Fund Program was created in 2011 for the purposes of promoting job creation and economic development projects. The fund was created by combining the former Investments in Major Projects and Comprehensive Training (IMPACT) and Kansas Economic Opportunities Initiative Fund (KEOIF).
Consequences of Not Funding this ProgramThe Job Creation Fund Program was created for the purpose of promoting job creation and economic development projects throughout the state. The JCF program is used as the deal closing fund for economic development projects. Many other states have a similar deal closing fund, allowing them to compete for highly competitive projects. If JCF is not funded, Kansas will not be able to compete for economic development projects, leading to a loss in new job creation and capital investment. Program GoalsA. Promoting job creation and economic development activity. Performance Measures
Business Development: KIT-KIRProgram HistoryThe Kansas Industrial Training (KIT) program started in 1978 to promote private sector training projects. In 1989, the Legislature created the Kansas Industrial Retraining (KIR) program for Kansas companies to train existing employees and at this time, both the KIT and KIR programs were established and placed into law. During the 2020 legislative session, Senate Bill 65, decoupling KIT and KIR from the High Performance Incentive Program, was signed into law by Governor Kelly.
Consequences of Not Funding this ProgramThe Kansas Industrial Training (KIT) and Kansas Industrial Retraining (KIR) programs assist eligible employers in training workers for new jobs and retraining existing workers who would otherwise be displaced because of obsolete job skills or knowledge. Lack of funding would result in the loss of a necessary tool used to create jobs, retrain/retain existing workers, and grow the economy. Program GoalsA. Provide training awards for net new job creation. B. Provide training awards for existing Kansas workers. Performance Measures
Business Development: Office of Minority and Women Business DevelopmentProgram HistoryThe Office of Minority and Women Business exists to assist small minority and women businesses in their business development activities by providing resources to include technical, financial, business management, certification and procurement information. The Office of Minority and Women Business Development was created in 1975 by Statute 74-5010a. On August 11, 1994, Governor Finney signed Executive Order 94-169 creating a single source Disadvantaged Business Enterprise (DBE) certification program in Kansas. A partnership between the Kansas Department of Transportation and the Kansas Department of Commerce was created related to certain processes of the certification program. In June 24, 2008 Governor Sebelius issued Executive Order 08-08 to expand the certification program to include additional designations for Women Business Enterprises (WBEs) and Minority Business Enterprise (MBEs).
Consequences of Not Funding this ProgramWithout funding for the Office of Minority and Women Business Development, there would be a lack of business development opportunities to serve minority and/or women-owned businesses which would lead to decreased readiness on the part of these businesses to perform effectively and be sustainable. There would also be decreased opportunities for federal agencies and private industry to meet their diversity goals by contracting with minority-and women-owned businesses. Recognizing that small, minority and women owned businesses are critical to the growth and development of the Kansas economy it is vital that these services are continued. Program GoalsA. Increase number of certifications by 10% overall to include outreach to Western Kansas. B. Collaborate with the Office of Contracts and Procurement to increase state contracting opportunities. C. Continue to provide business development services to women and minority businesses. Performance Measures
Business Development: PEAKProgram HistoryPEAK was created by the 2009 Legislature. The 2010, 2011 and 2014 Legislative Sessions passed subsequent changes to the Act effectively broadening the eligibility criteria resulting in increased program scope. The Legislature enacted PEAK to encourage economic development and job creation in Kansas by incenting companies to locate, relocate, expand or retain (retain incentives are no longer available via PEAK) their business facilities/operations and related jobs.
Consequences of Not Funding this ProgramPEAK is an economic development tool used to encourage economic development and job creation in Kansas by incenting companies to locate, relocate, expand, or retain their business facilities/operations and related jobs. Lack of funding would result in the loss of job and economic growth in Kansas. Program GoalsA. To foster economic development and the creation of new jobs and opportunities for the citizens of Kansas. B. To incentivize the location of business facilities, other operations and jobs in Kansas. Performance Measures
Business Development: Private Activity BondsProgram HistoryQualified Private Activity Bonds (PABs) are federally tax-exempt bonds. Under the federal volume cap, Kansas had a 2022 bond authority of $325,115,000 to allocate for this purpose. The types of bonds qualifying for such tax-exempt status are: 1) Exempt facility bonds; 2) Qualified mortgage bonds; 3) Qualified veterans' mortgage bonds; 4) Qualified small issue bonds; 5) Qualified student loan bonds; 6) Qualified redevelopment bonds; and 7) Qualified 501(c)(3) bonds. The role of the Department of Commerce is to ensure that these bonds are being used for a Qualified Purpose and that the State does not exceed the maximum capacity set forth by the Federal Government for Tax Exempt Bonds.
Consequences of Not Funding this ProgramQualified Private Activity Bonds (PABs) are federally tax-exempt bonds. In Kansas, the primary demand for bond allocation has been for the issuance of exempt facility bonds, mortgage revenue bonds and qualified small issue bonds also known as Industrial Revenue Bonds (IRBs). Lack of funding could result in lack of funding for certain housing projects, the beginning farmers program, and the first-time home buyers program Program GoalsA. Process applications, provide allocations, and manage the bond cap. B. Ensure that the allocation is expended each year for projects and first-time home buyers program. Performance Measures
Community Development DivisionProgram HistoryIn fiscal year 2020, the Community Development Division was re-established at the Department of Commerce. The existing Community Development programs and personnel were separated from Business Development to form the new Community Development Division. With the restoration of the division, Kansas Main Street was re-established as a program within the division; a division director was hired to provide oversight and coordination among the programs and services for maximum effectiveness; and additional staff were added. The Community Development Division includes programs and professional staff that provide grants, tax credits, technical assistance, and support for Kansas communities to help find solutions for various infrastructure and quality of life investments. The Community Development Division is focused on the needs of Kansas communities to enhance their current assets and improve their ability to attract residents and businesses.
Consequences of Not Funding this ProgramKansas communities will lose direct technical assistance for community development programs and incentives including CDBG, Community Service Tax Credits, Individual Development Accounts, RHID, MIH, tax credits, Housing Assessment Tool, asset mapping, creative and cultural resources, placemaking, public art and Kansas Main Street. Building and bridging of community assets in housing, childcare, and youth development would be lacking. Economic development in Kansas would lack a focus for community development opportunities, resulting in less livable communities through a variety of indicators. Community Development also provides indirect match for federal funding sources including CDBG and National Endowment for the Arts. Program GoalsA. Provide direct technical assistance in planning, development, housing resources, and funding preparation for Community Development programs. B. Provide program support and community assistance for Community Development programs. Performance Measures
Community Development Division: Community Development Block GrantProgram HistoryThe CDBG program was offered to states back in 1982 instead of HUD allocating the money to localities within a state. The Department of Commerce took over the program from HUD in 1984. The program has allocated $303,029,921 in CDBG funds with local matching dollars of $450,859,160 since 2004. It has benefitted 1,123,611 individuals of which 637,660 (56%) were low to moderate income. These individuals would be paying higher service rates or not have quality services without the CDBG grant program.
Consequences of Not Funding this ProgramCDBG grant awards provide vital infrastructure, building blocks that stimulate economic development, and key improvements to the quality of life across Kansas. This program benefits low to moderate income individuals and communities would not have access to sanitary water and sewer systems, decent housing to live in or community services without the CDBG funding. This would also affect communities that have had natural disasters that do not get FEMA dollars or not enough FEMA support to complete the project to restore services. Our program in the last year benefitted over 100,000 people, of which a minimum of 51% are low income. Program GoalsA. Leverage compared to CDBG dollars is 60% or greater each year. B. Number of applications received each year to be 60 or higher. C. Increase number of persons benefitting with a better quality of life. D. To increase the number of standard housing units through rehabilitation of substandard units through rehabilitation. Performance Measures
Community Development Division: Community Service Tax ProgramProgram HistoryThe Community Service Tax Credit Program (CSP) was established in 1994 and provides an opportunity for private, non-profit organizations and public health care entities to improve their ability to undertake major capital campaigns for projects involving children and family services, non-governmental crime prevention, youth apprenticeship and youth technical training and health care. Under this program, the state authorizes selected non-profit organizations to offer tax credits to donors making contributions to the approved projects. Applicants may request up to $250,000 in tax credits. Applicant organizations in rural areas (< 15,000 population) are eligible for a 70 percent credit. Applicant organizations in non-rural areas are eligible for a 50 percent credit. In 2019, Commerce began to earmark $1 million in tax credits to help address childcare and early childhood development needs for those providing services to those under the age of five. Eligible projects for childcare facilities consist of building renovations, equipment and educational materials and tools.
Consequences of Not Funding this ProgramThe Community Service Tax Credit Program has been a popular program among non-profits since 1994. Most recently, CSP has earmarked $1 million dollars to help address the lack of childcare in Kansas. Since doing so, there have been 8 childcare projects that have received tax credits. If CSP is not funded, many non-profits and hospitals will not be able to proceed with projects or they will be delayed as they search for alternative solutions for funding. In addition to that, nonprofit childcare facilities will lose one of the few funding options they can utilize to expand/build their facility in their community. CSP is a statutory program, not funding the program will result in non-compliance. Program GoalsA. Encourages cash and non-cash contributions to nonprofit organizations for certain community service activities. Performance Measures
Community Development Division: Individual Development Account ProgramProgram HistoryThe program was created in 2005. In 2009 Commerce designated Interfaith Housing Services, located in Hutchinson, as a sole provider of IDA in Kansas due to their demonstrated ability in administering IDAs and utilizing the necessary tax credit. In 2012 the Legislature revoked an individuals ability to receive tax credits for donating to the program. In 2015, the Kansas Legislature re-authorized individual donors to receive tax credits that resulted in full utilization of available tax credits in 2015, 2016,2017, 2018 and 2019. In 2019, Commerce reopened bids for IDA providers to have increase impact across the state. In 2022, Commerce revised the bidding process and refined the application process to be consistent with other tax credit programs.
Consequences of Not Funding this ProgramThe State Statute provides $500,000 per year in tax credits for the program. The impact of not funding the program is that no new Individual Development Accounts will have a state match on the funds saved and this will directly impact the non-profits who administer IDA program across the state. Program GoalsA. Facilitate self-sufficiency for low-income Kansans through asset development in a matched savings program. Performance Measures
Community Development Division: Kansas Creative Arts Industries CommissionProgram HistoryThe Kansas Arts Commission was founded in 1966 under the name Kansas Cultural Arts Commission, changing its name in 1973. The Kansas Arts Commission was funded through the State Legislature and the National Endowment for the Arts until June 2011, when all staff were laid off and the budget for the program zeroed out. The Kansas Arts Commission continued to function through its commissioners. The Kansas Creative Arts Industries Commission was created in FY13 and is housed in the Kansas Department of Commerce.
Consequences of Not Funding this ProgramThe Kansas Creative Arts Industries Commission is focused on the creative industries sector of the Kansas economy and is dedicated to measuring, promoting, supporting, and expanding the creative industries to grow the state's economy and create creative industry-related jobs. If the program is not funded, Kansas will lose access to federal funds from the National Endowment for the Arts, there will be long-term damage to cultural infrastructure, an increase in out-migration due to a loss of community vitality, an increase in unemployment in creative sector and organizational collapse in the creative and cultural sector. Program GoalsA. Engage more citizens in grant funded projects. B. Engage more creatives and organizations across KCAIC programs. Performance Measures
Community Development Division: Kansas Main StreetProgram HistoryThe Kansas Main Street program had a successful 27-year history beginning in 1985 and ending in 2012. During that time, dozens of communities in Kansas worked to revitalize their downtown districts and make the heart of their communities viable and strong. More than $600 million in reinvestment took place and more than 3,800 small businesses were started or expanded, creating over 8,600 new jobs. In the last year of the program alone, 25 designated communities established 194 new and expended businesses, created 568 new jobs and generated $18 million in reinvestment. With the rebirth of the program in late 2019, those 25 communities were grandfathered back into the program and once again have the resources and tools they need.
Consequences of Not Funding this ProgramWith 35 Designated Kansas Main Street communities and 40 Affiliate communities, not funding this program would leave more than 70 communities without any guidance and resources to help in their downtown revitalization efforts. Twenty-five of those Designated communities were in the program when it was abruptly closed in 2012 and all state funding for the program ceased to exist. The State program has brought in a significant number of consultants and resources for these Designated and Affiliate communities. Nearly $250,000 in services and technical assistance has been provided in coordination with Main Street America and other downtown specialists, with another $50,000 provided in design services that has helped property owners improve their downtown buildings. The state office now has three staff who provide a comprehensive level of technical assistance and on-site support. Not funding the Kansas Main Street program would mean the loss of three new grant programs that were created for Designated communities. These grants are for building improvements, upper-floor housing in downtown buildings, entrepreneurial development, and connecting arts programs with downtown programs. To date, nearly $660,000 in grants are being awarded, leveraging more than $1 million in private, local investment. The loss of these funds would significantly impact the ability of the local programs to leverage private, local dollars for these kinds of projects. Finally, Incentives Without Walls (IWW) grants were created in 1995 to stimulate private investment in Designated downtown districts. The last year those funds were awarded (FY13) $176,000 in grants were awarded and those funds leveraged nearly $1.3 million in private, local dollars. IWW funds have remained in most of the 25 communities since 2012, but the lack of funds added to the program has put a significant strain on the ability of the local programs to offer new loans for new projects. Program GoalsA. To provide technical assistance and resources--based on the Main Street Four-Point Approach-- to Designated Kansas Main Street communities who are working to meet national accreditation standards for success. B. To educate communities on the Main Street Four-Point Approach so they may have increased local capacity in their downtown revitalization efforts. C. To maintain and grow membership in the Kansas Main Street Affiliate program. D. To develop and manage new grant opportunities for Designated communities and (where appropriate) other communities throughout the state. Performance Measures
International DivisionProgram HistoryThe International Division works with Kansas companies to help them sell their products and services in international markets. The Division also works to recruit international businesses to establish facilities and create jobs in Kansas. The International Division became a standalone division within the Department in FY21, after having been eliminated as a separate business unit in FY13. During those eight years these functions were managed by a much smaller staff operating out of the Business Development Division.
Consequences of Not Funding this ProgramA lack of funding for the International Division would have detrimental effects on the Kansas businesses that export goods and services. Without support from the Department of Commerce, fewer Kansas companies will export and the exports that do happen will result in fewer sales. international business recruitment efforts will also be negatively impacted. With more international attending on Kansas and international companies interested in foreign direct investment in the state, our economic development efforts in these areas will greatly suffer without funding. Program GoalsA. Increase the number of Kansas exporters and Kansas exporter market diversification. B. Recruit international businesses to establish facilities and create jobs in Kansas. Performance Measures
International Division: Kansas International Trade Marketing Assistance ProgramProgram HistoryThe Kansas International Trade Marketing Assistance Program (KITMAP) helps introduce Kansas companies to foreign markets by funding their export marketing efforts including international airfare, overseas lodging on foreign sales trips, market research, new foreign language company brochures, etc. Eligible companies are those whose product or service originates in Kansas or whose products receive substantial value-added processing in Kansas.
Consequences of Not Funding this ProgramThe Kansas International Trade Marketing Assistance Program (KITMAP) helps introduce Kansas companies to foreign markets by funding their export marketing efforts including international airfare, overseas lodging on foreign sales trips, market research, new foreign language company brochures, etc. Without funding, fewer Kansas companies will have the support, technical assistance and expertise needed to export, which will result in a decrease in exports from Kansas and a reduction in sales. Program GoalsA. To help introduce Kansas companies to foreign markets by funding their participation in international trade shows. Performance Measures
International Division: Kansas International Trade Show Assistance ProgramProgram HistoryThe Kansas International Trade Show Assistance Program (KITSAP) helps introduce Kansas companies to foreign markets by funding their participation in international trade shows. Eligible companies are those whose product or service originates in Kansas or whose products receive substantial value-added processing in Kansas. The program was created in 1990 (KSA 74-5075) and later amended in 1994 (KSA 74-50141). It continues today to be one of the most useful and productive programs supporting Kansas trade expansion.
Consequences of Not Funding this ProgramThe Kansas International Trade Show Assistance Program (KITSAP) helps introduce Kansas companies to foreign markets by funding their participation in international trade shows. Without funding, fewer Kansas companies will have the support, technical assistance and expertise needed to export, which will result in a decrease in exports from Kansas and a reduction in sales. Program GoalsA. To help introduce Kansas Companies to foreign markets by funding their participation in international trade shows. Performance Measures
International Division: State Trade Expansion ProgramProgram HistoryThe Small Business Administration began the State Trade Expansion Program (STEP) in 2011 to provide assistance via qualifying state government delivery agencies to US companies to market and sell their products and services internationally. States apply for funding annually. Funding is not guaranteed and awards are made based upon program fund utilization plans. Kansas applied for and received this first STEP grant in 2011 and has continued to receive and deploy STEP funding to the present day.
Consequences of Not Funding this ProgramThe State Trade Expansion Program (STEP) provides assistance to Kansas companies to market and sell their products and services internationally. Without funding, fewer Kansas companies will have the support, technical assistance and expertise needed to participate in international trade and exporting, which could result in a decrease of Kansas exports. Additionally, fewer exporters will participate in the state-organized pavilion at annual European airshows as they will need to bear the entire cost of their participation. Program GoalsA. Increase the number of Kansas companies starting to export. B. Diversify the export markets for Kansas companies. Performance Measures
Office of InnovationProgram HistoryThe Office of Innovation was created in July 2021 in response to findings of the Framework for Growth which identified Kansas near the bottom for innovation commercialization. Kansas' competitive position was in decline causing loss of talent and new business growth opportunities, both key to future growth and stability in the Kansas economy. Upon creation of the Office of Innovation a new program was launched, Proof of Concept, and reorganization occurred in the Department of Commerce by moving the Angel Investor Tax Credit program from the Community Development Division to the Office of Innovation. As of July 2022 the Office of Innovation manages three programs: Proof of Concept, Angel Investor Tax Credits, and Small Business R&D Acceleration Grants. The Office of Innovation provides oversight and direction to the SSBCI programs administered by Network KS.
Consequences of Not Funding this ProgramThe Office of Innovation provides critical programs and ecosystem building functions in support of innovation based business creation, expansion and attraction. Innovation is the driver of an economy and failure to fund this program will result in loss of future economic growth and a decline of career opportunities for Kansas high school and college graduates. Program GoalsA. Increase number of Kansas innovations reaching market through Proof of Concept program and the Small Business R&D Acceleration Grants program. B. Accelerate the growth of Kanas scalable businesses through the Angel Investor Tax Credit program (see sub program). C. Increase sources of capital, dilutive and non-dilutive, for scalable Kansas businesses. Performance Measures
Office of Innovation: Angel Investor Tax Credit ProgramProgram HistoryThe Legislature created the program in 2004. In 2011 the program was moved from KTEC to KDC. In 2021 the program was extended for 5 years and granted additional tax credit for qualified companies.
Consequences of Not Funding this ProgramKAITC is the only program the state offers that focuses on Kansas start up companies having a hard time funding their innovative businesses. Without this program the state will miss out on grassroots growth of new companies that create jobs and economic benefits in Kansas. Businesses that start in Kansas leave the state when they cannot find funding sources. Not funding the program puts a higher risk of outward migration of home grown Kansas companies. Program GoalsA. Assist in the creation and expansion of Kansas businesses, which are job and wealth-creating enterprises. B. Facilitate the availability of equity investment in businesses in the early stages of commercial development. Performance Measures
Office of Rural ProsperityProgram HistoryThe Office of Rural Prosperity was established in 2019 under Lt. Governor Lynn Rogers. In 2021, this office was moved into the Kansas Department of Commerce, as a stand alone department under Lt. Governor and Secretary of Commerce, David Toland. Trisha Purdon was hired in late May 2021 to lead the Office of Rural Prosperity. There are 4 ORP team members including one ROZ specialist as of June 2022.
Consequences of Not Funding this ProgramThe Office of Rural Prosperity provides dedicated support for rural communities across Kansas in the areas of Housing, Childcare, Workforce, Healthcare, Arts & Culture, Community and Economic Development, and Broadband/Infrastructure. The consequences for not funding ORP would be to slow progress in these areas for rural Kansas, which would only intensify these challenges facing rural communities and likely contributing to further population loss for rural parts of Kansas. Program GoalsA. Collaborate with other state and local partners to increase or improve housing program opportunities, and provide support for communities in developing or redeveloping housing. B. Partner with state, regional, and local agencies to improve childcare opportunities, training programs, and entrepreneurial programs to support the growth of childcare facilities in rural Kansas. C. Improve rural community growth through grassroots economic development trainings and tools, workforce recruitment, infrastructure improvements, and community resources that help foster entrepreneurship, innovation, community revitalization, building preservation/development, beautification, business development, technology, and quality job creation. D. Support efforts to improve and stabilize healthcare and wellness access in rural Kansas communities. E. Collaborate with other state and private industry partners to improve access to high speed internet in all areas of rural Kansas, as well as other key infrastructure needed to help communities prosper. Performance Measures
Public Broadcasting CouncilProgram HistoryThe Kansas Public Broadcasting Council (KPBC) was established in 1993 by the Kansas Legislature and charged with coordinating public broadcasting activities in the state. State dollars are allocated through a statutory formula to nine member stations. More broadly, stations are charged with achieving the goal of every Kansan having access to the quality, informational, educational and cultural content of public media. KPBC shares the Department of Commerce's goal to improve and promote the quality of life for the entire population of Kansas. The nine KPBC stations have provided consistent service to all 105 Kansas counties--a unique degree of state coverage. We aspire to cover the entire population, but realistically our coverage will be only a portion of that total at any given moment. KPBC stations are usually primary providers of public media content for Kansas residents, especially residents of rural areas, and residents of western Kansas. Not reflected in our outcome measures at this time is the number of community partnerships KPBC member stations engage in. Many non-profits--volunteer fire departments, arts organizations, social service agencies, universities, and others--work with our stations to engage with their constituencies and the broader communities they serve.
Consequences of Not Funding this ProgramThe Public Broadcasting Council is charged with achieving the goal of every Kansan having access to public media. To achieve this goal, member stations provide community service by delivering quality, informational, educational, and cultural content to all corners of Kansas. Not funding this program would result in possible reduction in staffing (especially in western Kansas), a reduction in capacity for local/regional programming, and a loss of federal dollars, which are in part calculated by the level of non-federal financial support. Program GoalsA. Rural Public Media Services. B. Literacy Support and Achievement. C. Leverage Collaborative Partnerships. Performance Measures
Rural Opportunity ZonesProgram HistoryEstablished in 2012 with the primary goal of reducing out-migration in rural Kansas counties. The program has two components, each available for up to five years: state income tax waiver and student loan repayment assistance. The program now covers 95 of 105 counties with populations less than 40,000. The Department of Commerce is only responsible for the student loan portion of the ROZ program.
Consequences of Not Funding this ProgramApproved participants in the program who are still actively in the 5 year program cycle will not receive their annual distribution. This would be a violation of statute 74-50,223(b). KDC will also not accept new applications for the program in any year there is no funding for participants. Program GoalsA. Combat population decline in rural Kansas and reduce out-migration. B. Bring educated professionals to the rural parts of Kansas. Performance Measures
Tourism DivisionProgram HistoryKansas Tourism has the mission to inspire travel to and throughout Kansas to maximize the positive impacts that travel has on the state and local communities. In 2011, Kansas Tourism was moved by ERO from the Kansas Dept of Commerce to Kansas Dept of Wildlife, Parks and Tourism. In 2021, Kansas Tourism was moved back to the Kansas Dept of Commerce by ERO 48. The specific duties of Kansas Tourism are to market Kansas to visitors; produce visitor publications including an annual travel guide; TravelKS.com; increase visitation to the state; increase Kansans awareness and pride for the state; conduct appropriate tourism research; and to provide support to members of the Kansas tourism industry across the state. Other programs that Kansas Tourism oversees include the Kansas Agritourism Program, Kansas Byways Program, KANSAS! magazine, Attraction Development Grants, Marketing Grants, and initial approval of brown and blue signage.
Consequences of Not Funding this ProgramThe mission of the Kansas Tourism Division is to inspire travel to and throughout Kansas, and to maximize the positive impacts that tourism has on the state and local communities. A lack of funding would result in decreased visitation to and throughout Kansas resulting in a loss of jobs, lower transient guest tax and sales tax collections, and decreased overall economic impact for the state and local communities. The Pandemic highly affected the tourism industry, and sufficient marketing of Kansas Tourism assets are vital for a full economic recovery. Program GoalsA. Increase number of visitors to Kansas. B. Increase statewide Transient Guest Tax collections. C. Increase visitor spending. D. Increase number of registered Agritourism businesses. Performance Measures
Workforce AID/KTRAINProgram HistoryWorkforce AID, which began in 2014, is a partnership between the Kansas Department of Commerce and the Kansas Board of Regents developed to address the skills gap in Kansas through development of a talent pipeline. Workforce AID is an industry-driven program that aligns industry opportunities and demands with workforce training and education. Using short-term, highly focused training programs in college credit and industry-recognized credentials, Workforce AID finds, trains and delivers Kansas employers a skilled, certified workforce. Workforce AID is nationally recognized by the US Chamber of Commerce Foundation and supports economic and workforce development by keeping Kansas businesses competitive and promoting a more robust economy.
Consequences of Not Funding this ProgramWorkforce AID provides employers with short-term, customized training with college credit and industry-recognized credentials to help build and sustain their talent pipeline. Employers would have more difficulty hiring trained and skilled employees without this program. Industries would not recognize Kansas as a location of choice due to not having the capacity to deliver a talent pipeline to meet their needs. Program GoalsA. Utilize new and innovative industry-driven talent solutions to develop short-term, customized training projects with employers and education institutions. B. Deliver skilled employees to Kansas employers. C. Provide students with a contingent offer of employment and college credit/industry recognized credentials. D. Build and deliver a sustainable talent supply chain for Kansas industries. Performance Measures
Workforce ServicesProgram HistoryFederal workforce development legislation is said to have originated with President Franklin D. Roosevelt's New Deal legislation (1933-1938). During the Great Depression, employment across the nation fell to an all-time low. In 1962, President John F. Kennedy recognized that unemployment was again on the rise, and the worker skills gap was increasing rapidly with a changing economy. The Manpower Development and Training Act (1962-1973) was designed to provide training to unemployed adults and a small percentage of youth workers whose skills needed to be upgraded to enter or re-enter the workforce. The Comprehensive Employment and Training Act (CETA), implemented in 1973 (1973-1982), resulted from many revisions to the Manpower Development and Training Act. CETA was designed to create jobs for unemployed adults and provide summer job opportunities for high school students. A primary focus of CETA was apprenticeships for unemployed or underemployed individuals to help them gain experience and on-the-job training. The Job Training and Partnership Act (JTPA) (1982-1998) further consolidated education and job training programs by setting up regional Service Delivery Areas (SDAs) in each state, but still placed a heavy responsibility on the federal government. These SDAs evolved into today's Workforce Investment Areas. Fourteen years after the Job Training Partnership Act, President William J. Clinton spearheaded the passage of the Workforce Investment Act (WIA) (1998-2014). Enacted during a period of full employment, WIA focused on the delivery of workforce development programs and related services through a nationwide network of community-based, one-stop career centers. On July 22, 2014, President Barack Obama signed the Workforce Innovation and Opportunity Act of 2014 (WIOA), which reauthorizes the workforce investment system and replaces the Workforce Investment Act of 1998. WIOA took effect on July 1, 2015. The Workforce Services Division links businesses, job candidates and educational institutions to ensure that employers can find skilled workers.
Consequences of Not Funding this ProgramThe Workforce Services Division is responsible for the links to businesses (employers), education institutions and jobseekers to ensure the placement of qualified and skilled workers. The division and it's partners are dependent upon federal funding to ensure Kansans are receiving proper core and intensive services via training opportunities, job referrals and placements. The impact of not funding this division would result in loss of employment opportunities for Kansas job seekers and matching of qualified candidates to opportunities with employers within the state. Funding is vital to maintain an integrated, demand-driven statewide network. Program GoalsA. Customer Service. B. Performance Accountability and Transparency. C. System Messaging and Awareness. D. Technology Integration. Performance Measures
Workforce Services: Foreign Labor CertificationProgram HistoryForeign labor certification programs permit U.S. employers to hire foreign workers on a temporary or permanent basis to fill jobs essential to the U.S. economy. Certification may be obtained in cases where it can be demonstrated that there are insufficient qualified U.S. workers available and willing to perform the work at wages that meet or exceed the prevailing wage paid for that occupation in the area of intended employment. Foreign labor certification programs are designed to assure that the admission of foreign workers into the United States on a permanent or temporary basis will not adversely affect the job opportunities, wages, and working conditions of U.S. workers. Administration of the programs is mandated by the Immigration and Nationality Act (INA) and delineated by regulations in each program published in the Code of Federal Regulations. Kansas receives funding from USDOL to administer the Foreign Labor Certification program to provide services to employers having difficulty finding qualified U.S. workers to fill job openings.
Consequences of Not Funding this ProgramThis program is federally funded. If not funded by the state, the program will not meet federal requirements. Program GoalsA. Meet employer needs and enhance competitiveness of the nation. Performance Measures
Workforce Services: Jobs for Veterans GrantProgram HistoryThe Jobs for State Veteran's Grants (JVSG) Program is a federally funded program which provides "priority of services" to eligible Veterans under 38 USC 4101 (4) and 4211 (4), and other eligible spouses as defined in 38 USC 4101 (5). This program is three-fold: 1) Disabled Veteran Outreach Program Consultants (DVOP) under guidance of 38 USC 4103A (a) provide intensive services and facilitates job placements to meet the employment needs of veterans prioritizing services to special disabled Veterans, disabled Veterans and other Veterans that may have Significant Barriers to Employment; 2) Local Veteran Employment Representatives (LVER) under 38 USC 4104 (b) principal duties are to: (1) Conduct outreach to employers to assist veterans in gaining employment; (2) Facilitate employment, training and placement services furnished under KANSASWorks (state delivery system); 3) Intensive Services Coordinator (ISC) acts a liaison between the Department of Commerce and the Department of Veteran Affairs (VA). This position accepts veteran referrals under Chapter 31 Veteran Readiness and Employment (VA (VR&E) that are entering the job readiness phase of their rehabilitation. The ISC additionally provides oversight on all other matters pertaining to the veteran including the (VR&E) counselor and DVOP to facilitate a smooth transition into civilian employment.
Consequences of Not Funding this ProgramThis is a Federally Funded Program through DOL-Veterans Employment and Training Services (VETS). Commerce would not meet the statutory requirements of the Jobs for Veterans Services Grant (JVSG). Program GoalsA. Federal Outcome measure - Employment Rate 2nd quarter after exit (%), 54% or better. B. Federal Outcome measure - Employment Rate 4th quarter after exit (%), 50% or better. C. Federal Outcome measure - Median earnings 2nd quarter after exit ($), $5,939 or better. Performance Measures
Workforce Services: My ReEmploymentProgram HistoryBeginning in June 2021, the My (Re)Employment Plan was revived and updated in HB2196. This collaboration between the Kansas Department of Labor, Kansas Department of Commerce and the KANSASWORKS Workforce system provides enhanced reemployment services to Kansans who are unemployed and looking for work. The program, called "My (Re)Employment Plan" connects unemployment recipients with workforce service professionals in their area.
Consequences of Not Funding this ProgramIf not funded the program would not meet the statutory requirement of HB 2196 Program GoalsA. Increase the Employment Rate 2nd quarter after exit (%). B. Increase Employment Rate 4th quarter after exit (%). Performance Measures
Workforce Services: Older Kansans Employment ProgramProgram HistoryOKEP is funded by the Kansas Legislature and is designed to provide employment placement services to Kansan's 55 years of age and over with emphasis on employment in the private sector. The Older Kansans Employment Program provides specialized training, career assessment, job-matching and job search assistance to Kansans age 55 and older regardless of their income and facilitates the development of job opportunities for older Kansans in private industry. This funding is provided to non-profit 501(c)3s and other community-based, non-profit organizations who administer the program. OKEP has expanded to new areas of the state, allowing for more older workers to benefit from the specialized program.
Consequences of Not Funding this ProgramThe Older Kansans Employment Program provides specialized training, career assessment, job-matching, and job search assistance to Kansans aged 55 and older regardless of their income and facilitates the development of job opportunities for older Kansans in private industry. If the program is not funded we will not be able to provide employment placement services to Kansans 55 and older. Program GoalsA. Increase the number of placements into unsubsidized employment. Performance Measures
Workforce Services: Pathway Home 2Program HistoryIn June 2021, the Kansas Department of Commerce was awarded a $3,997,764 grant from the US Dept. of Labor Employment and Training Administration for the Pathway Home 2 project. The period of performance is from July 1,2021 to December 31, 2024. Pathway Home 2 seeks to provide eligible, incarcerated individuals with workforce services within 20 and 180 days of release from a correctional facility. Participating individuals will have access to services that aid them in preparation to enter sustainable, living wage employment in a high demand industry in the local labor market of the community which they plan to return. These services include, but are not limited to job preparation; individualized plans that address barriers to employment; career exploration and planning; counseling; assistance obtaining state identification required for employment; and assistance linking residents to the social services required to help them transition back to their communities. A key feature of this program is the participants' case manager, whom they have built a relationship with, will remain with them post-release to support skill-building, job attainment, and employment retention. Partnerships with internal and external service providers ensure that participants' barriers to employment are addressed, to aid in their success and reduce recidivism.
Consequences of Not Funding this ProgramPathway Home 2 seeks to provide eligible, incarcerated individuals with workforce services within 20 and 180 days of release from a correctional facility. Lack of educational attainment and marketable skills blocks individuals returning from incarceration from much of the living wage work in their community. Individuals unable to access sustainable living wage employment risk returning to incarceration, which results in a cost to taxpayers of roughly $30,000 annually and a decrease in public safety. Program GoalsA. Increase living wage employment for individuals exiting Kansas correctional facilities. B. Completion of training or credential attainment in a high demand occupation. C. Reduction in recidivism for program participants. Performance Measures
Workforce Services: Rapid Response ProgramProgram HistoryThe 1988 passage of the Economic Dislocation and Worker Adjustment Assistance Act (EDWAA) required all states to establish state-level Dislocated Worker Units with Rapid Response teams that provide early-intervention services. Rapid Response is a pro-active, business-focused, and flexible strategy designed to respond to layoffs and plant closings by quickly coordinating services and providing immediate aid to companies and their affected workers. Rapid Response teams will work with employers and any employee representative(s) to quickly maximize public and private resources to minimize disruptions associated with job loss. Rapid Response can provide customized services on-site at an affected company, accommodate any work schedules, and assist companies and workers through the painful transitions associated with job loss. Rapid response encompasses strategies and activities necessary to (1) plan for and respond to as quickly as possible following either an announcement of a closure or layoff, or mass job dislocation resulting from a disaster, natural or otherwise; and (2) deliver services to enable dislocated workers to transition to new employment as quickly as possible. In August 1988, Congress passed the Worker Adjustment and Retraining Notification Act (WARN) to provide workers with sufficient time to seek other employment or retraining opportunities before losing their jobs. WARN helps ensure advance notice in cases of qualified plant closings and layoffs.
Consequences of Not Funding this ProgramRapid Response is a federally funded program by the U.S. Dept. of Labor that is required to be administered by each state. Not funding this program is not an option under federal statute and regulations. Workforce Innovation Opportunity Act (WIOA) 20 CFR Part IV Program GoalsA. For WARN and Non-WARN events, offer all employers informational meetings and/or Rapid Response packet information, regardless of number of laid off workers. Performance Measures
Workforce Services: Reemployment Services and Eligibility AssessmentProgram HistoryThe Unemployment Insurance (UI) program is a required partner in the broader public workforce system and provides unemployment benefits to individuals who have lost their employment through no fault of their own and who otherwise meet initial and continuing UI eligibility requirements. Beginning in 2005, the U.S. Department of Labor, Employment and Training Administration funded the voluntary UI Reemployment and Eligibility Assessment (REA) program to address individual reemployment needs of UI claimants, as well as prevent and detect improper benefit payments. In 2015, the Reemployment Services and Eligibility Assessment (RESEA) program replaced the REA program providing greater access to reemployment services in addition to services previously provided under the REA program. Reemployment Services and Eligibility Assessment (RESEA) is a collaboration between the Kansas Department of Commerce and the Kansas Department of Labor. Commerce has administered the program in some capacity since 2009. RESEA is provided in sixteen Job Centers around the state. There are fifteen grant-funded positions located at five Job Centers. Wagner-Peyser funded staff provide RESEA services in offices that do not have dedicated staff. Claimants scheduled for RESEA are required to report to a workforce center as a condition to receiving UI benefits. Due to COVID-19 related capacity constraints, RESEA was on hiatus until mid-March 2021.
Consequences of Not Funding this ProgramRESEA is a federally funded program through U.S. Dept. of Labor Employment and Training Administration. If not funded the program will not meet grant requirements and will lose associated grant funds Program GoalsA. Number of claimants receiving Unemployment Benefits Served. B. Decrease the number of RESEA customer who fail to report for services. Performance Measures
Workforce Services: Registered Apprenticeship ProgramProgram HistoryFollowing the creation of the first Registered Apprenticeship system in Wisconsin in 1911, the United States Congress passed the National Apprenticeship Act in 1937, establishing federal Registered Apprenticeship. Initially, Registered Apprenticeship programs consisted mainly of the manufacturing, construction and utilities industries. After World War II, Registered Apprenticeship began to expand into training of health and safety workers, including firefighters, police, and emergency medical technicians. The program guidelines were revised in late 2008 to allow for greater flexibility in serving apprentices and program sponsors in prevailing economic conditions. The National Apprenticeship Act authorizes the Federal government, in cooperation with the states, to oversee the nation's apprenticeship system. The U.S. Department of Labor's Office of Apprenticeship works in conjunction with the Bureau of Apprenticeship and Training as well independent State Apprenticeship Agencies to administer the program. The purpose of Registered Apprenticeship (RA) is to develop an employer-driven, "Earn While You Learn" program model that combines on-the-job learning with related technical instruction that increases an apprentices' skill level and wages in both traditional and non-traditional industries. It is an immediate job; apprentices start working from day one. The Registered Apprenticeship system effectively meets the needs of both employers and workers. It is a flexible training system that is customized to meet the needs of every business. This program is used to grow and diversify apprenticeship opportunities for under-served populations, youth, new hires, and incumbent workers. Employer participation is the key to building a Registered Apprenticeship program, without employer participation there is no Registered Apprenticeship program. By promoting new and existing industry sectors Registered Apprenticeship will expand earn and learn opportunities statewide. On Sept 6, 2022, Governor Laura Kelly established the Kansas Office of Registered Apprenticeship through Executive Order #22-07. The Office will dramatically scale up the state's efforts to meet the talent needs of Kansas businesses, give workers the skills and experience they need to compete in the modern economy, and knock down barriers to employment.
Consequences of Not Funding this ProgramThe Registered Apprenticeship program is federally funded through U.S. Dept. of Labor Employment and Training Administration Grant Awards and the Workforce Innovation and Opportunity Act funding. If this program is not funded the program will not meet federal grant requirements. Program GoalsA. Expand Registered Apprenticeship through the registration of new sponsors and the expansion of existing sponsors. Performance Measures
Workforce Services: Retaining Employment & Talent After Injury/Illness NetworkProgram HistoryIn September 2018, Commerce received a $1,877,823 grant from the US Department of Labor, Office of Disability Employment Policy to establish relationships between the workforce system and medical service delivery system to develop processes to help individuals who have suffered a debilitating illness or injury to stay at or return to work. The program period of performance and subsequent funding has been extended an additional 12 months, from April 1, 2020 through March 31, 2021, with total funding increased to $2,303,757. In 2021 the Kansas Department of Commerce, in partnership with all five Local Workforce Development Boards in Kansas, the Kansas Department of Health and Environment, Ascension Via Christi Healthcare System and four additional Healthcare systems, has been awarded an additional $21.6 million for a Phase II of the grant.
Consequences of Not Funding this ProgramThe adverse impacts of workers leaving the workforce because of illness or injury on state governments, as well as on the individuals and employers, can be significant and long-lasting. This can result in associated costs to the state due to a reduction in tax base and decreased individual spending; costs to employee due to reduction of income which can have a life-changing impact on health, family finances and quality of life. This impacts employers who shoulder the direct and indirect costs that result from the loss of valuable employees. Program GoalsA. To increase employment retention and labor force participation of individuals who acquire and/or are at risk of developing work disabilities. B. To reduce long-term work disability among project participants, including the need for federal disability benefits (SSDI and SSI). Performance Measures
Workforce Services: Senior Community Services Employment ProgramProgram HistorySCSEP is the only federally mandated job training program that explicitly serves low income adults, age 55 years and older. It was first authorized under Title II of the Economic Opportunity Act of 1964 and funded in 1965 as part of a demonstration project called Operation Mainstream. Operation Mainstream's objective was broader than just older adults, but seniors were one targeted population. Operation Mainstream was run by national nonprofit agencies until 1973 when the older worker component of the program was converted from a pilot project to an established program under Title IX of the OAA. The amendment modified the program to allow both state governments as well as national nonprofit agencies to receive funds. In 1978, the program was re-designated as Title V of the Older Americans Act, and this is still the statutory authorization of the program today. SCSEP provides part-time community service assignments for low-income adults, 55 years and older to promote transition to unsubsidized employment. The COVID pandemic resulted in greatly reduced community service assignments and on-the-job placements due to the temporary closure of most of the community-based organizations which provide on-the-job opportunities for SCSEP participants.
Consequences of Not Funding this ProgramThe U.S. Department of Labor requires the state to match 10% of the funding for the Senior Community Service Employment Program (SCSEP). Failure to allocate funding for SCSEP would result in the loss of the SCSEP program. This would be detrimental to older Kansans who rely on the training and subsidized wages provided by SCSEP. Many older Kansans rely on the subsidized wages to pay rent and utilities, keeping many from homelessness. Program GoalsA. Increase Median Earnings (Quarter) - ($3465). B. Increase Employment Rate 2nd Quarter after exit - 29%. C. Increase Employment Rate 4th Quarter after exit - 27.1%. Performance Measures
Workforce Services: Trade Adjustment Assistance ProgramProgram HistoryThe Trade Adjustment Assistance (TAA) Program is a federal program established under the Trade Adjustment Assistance Reauthorization Act of 2015 that provides aid to workers who lose their jobs or have hours of work and wages reduced as a result of increased imports. The TAA program offers a variety of benefits and reemployment services to help unemployed workers prepare for and obtain suitable employment. Workers may be eligible for training, job search and relocation allowances, income support, and other reemployment services. Reemployment TAA (RTAA) provides wage supplements for reemployed older workers whose reemployment resulted in lower wages than those earned in their trade-affected employment.
Consequences of Not Funding this ProgramThis program is federally funded by the U.S. Dept. of Labor. If not funded by the state the program will not meet federal requirements. Program GoalsA. Provide aid to workers who lose their jobs or have hours of work and wages reduced as a result of increased imports. B. Provide a variety of benefits and reemployment services to help unemployed workers prepare for and obtain suitable employment. Performance Measures
Workforce Services: Wagner-Peyser ActProgram HistoryThe Wagner-Peyser Act of 1933 established a nationwide system of public employment offices, known as the Employment Service. The Wagner-Peyser Act was amended in 1998 to make the Employment Service part of the one-stop delivery system under the Workforce Investment Act. In 2014, the Wagner-Peyser Act was amended again under Title III of the Workforce Innovation and Opportunity Act (WIOA)The Wagner-Peyser Act establishes a national employment system to provide workforce services including assessment, testing, counseling, occupation and labor market information, referral to job openings, employment services for groups with special needs, and recruitment services and special technical services for employers. Customers seek services electronically or receive staff assistance by vising a workforce center.
Consequences of Not Funding this ProgramThis is a federally funded program by U.S. Dept. of Labor with required activities by State merit staff. Not funding this program is not an option under federal statute and regulations. Workforce Innovation Opportunity Act (WIOA) 20 CFR Part IV Program GoalsA. WIOA, Title III Federal Outcome measure - Employment Rate 2nd quarter after exit (%). B. WIOA Title III, Federal Outcome measure - Employment Rate 4th quarter after exit (%). C. WIOA, Title III, Federal Outcome measure - Median earnings 2nd quarter after exit ($). Performance Measures
Workforce Services: Work Opportunity Tax Credit ProgramProgram HistoryThe Work Opportunity Tax Credit (WOTC) is a federal tax credit available to employers hiring individuals from certain target groups who have consistently faced significant barriers to employment. The Work Opportunity Tax Credit (WOTC) is authorized until December 31, 2025 (Section 113 of Division EE of P.L. 116-260 -- Consolidated Appropriations Act, 2021). WOTC targeted groups include: 1) Qualified IV-A recipient; 2) Qualified Veteran; 3) Qualified Ex-Felon; 4) Designated Community Resident; 5) Vocational Rehabilitation Referral; 6) Summer Youth Employee; 7) Supplemental Nutrition Assistance Program (SNAP) recipient; 8) Supplemental Security Income (SSI) recipient; 9) Long-term Family Assistance recipient; and 10) Qualified Long-term Unemployment recipient.
Consequences of Not Funding this ProgramLoss of funding for the Work Opportunity Tax Credit Program would detrimentally impact the State of Kansas' business growth and economic development. Employers utilize this tax credit when hiring individuals that have a significant barrier to employment which helps stimulate the growth and sustainability of their business. This program also assists the employee by assisting them to gain lasting and gainful employment. Federally funded by US DOL. Program GoalsA. Assist Kansas Employers in utilizing the WOTC Program and increase the number of qualified certification requests for approval. Performance Measures
Workforce Services: Workforce Innovation and Opportunity ActProgram HistoryOn July 22, 2014, President Barack Obama signed the Workforce Innovation and Opportunity Act of 2014 (WIOA), which reauthorizes the workforce investment system and replaces the Workforce Investment Act of 1998. WIOA took effect on July 1, 2015. Title I of WIOA authorizes programs to provide job search, education, and training activities for individuals seeking to gain or improve their employment prospects, and which establishes the One-Stop delivery system. In addition, Title I of WIOA establishes the governing structure and the performance accountability for all programs authorized under WIOA. Workforce services in WIOA, administered by Commerce, are funded through four separate programs: Adult Program, Dislocated Worker Program, Youth Program and Wagner-Peyser Labor Exchange. Nearly all the Adult, Dislocated Worker and Youth funds are allocated by statutory formula to the Local Workforce Development Boards for direct service delivery to eligible individuals per the requirements of the Act. Kansas is divided into five Local Workforce Development Areas, each overseen by a separate Local Board.
Consequences of Not Funding this ProgramThis is a federally funded program by US DOL, required to be administered by each State. Not funding this program is not an option under federal statute and regulations. Workforce Innovation Opportunity Act (WIOA) 20 CFR Part IV Program GoalsA. Assist Kansans', including youth and those with significant barriers to employment, into high-quality jobs and careers and help employers retain skilled workers. B. Increase the number of Kansans' served (Adult, Dislocated Worker, Youth). Performance Measures
Department of Credit UnionsAdministrationProgram HistoryKansas Department of Credit Union was established in 1968 under K.S.A 17-2234. Information related to the agency in general can be found at K.S.A 17-2201.
Consequences of Not Funding this ProgramState chartered credit unions would not be examined on a regular basis and Kansas citizens could be subject to undue risk that could have been eliminated by an exam. Program GoalsA. Each program must be examined at least once every 18 months. Performance Measures
Department of RevenueAdministrationProgram HistoryKSA 75-5101 provides for the organization of the Department of Revenue and delineates the powers of the Secretary of Revenue. KSA 75-5127 allows the Secretary to organize the Department of Revenue in a manner that will promote efficiency.
Consequences of Not Funding this Program1) Lack of oversight of KDOR core functions. 2) Inability to adhere to State policies and procedures for accounting, procurement, and personnel management. 3) Unable to handle administrative and court matters and legal analysis in-house. 4) Reduced ability to manage vital tax, vehicle, and credential information. 5) Fiscal notes, open records requests, and statistical reports not completed in a timely manner. 6) Non-compliance with state and local tax statutes and taxpayers not remitting the correct amount of tax. Program GoalsA. The Office of the Secretary is responsible for ensuring the agency follows it's mission. B. Represent the agency in litigation and provide legal advice to the Department of Revenue. C. Support the development of efficient tax laws and consistent policies. Performance Measures
Aid to Local UnitsProgram HistoryThis program provides for the distribution of certain State-collected taxes and fees to local units of government as aid. Local aid distributions include: sand royalties, fees collected from the sale of full-privilege motor vehicle dealer license tags, mineral production taxes and assessments of delinquent taxes and penalties imposed for nonpayment of taxes on marijuana and controlled substances.
Consequences of Not Funding this Program1) Violation of the established state statues and regulations. 2) The local jurisdictions would not receive revenue from the State of Kansas. Program GoalsA. Be accountable for the distribution of aid payments to local governments. B. Ensure that all aid payments are made on or before the scheduled distributions dates. Performance Measures
Alcoholic Beverage ControlProgram HistoryIn 1949, the Kansas Legislature created the Alcoholic Beverage Control (ABC) to regulate the liquor industry after prohibition was lifted. ABC regulates and enforces the Liquor Control Act, Club and Drinking Establishment Act, and the Keg Tag Act. The Cereal Malt Beverage (CMB) Act requires ABC to add a State CMB stamp to locally issued CMB retailer licenses.
Consequences of Not Funding this Program1) Threat to public safety particularly as it applies to minors. 2) Potential influx of criminal activity masked within the industry. Program GoalsA. Regulate licensees in an efficient, capable, fair, and professional manner. B. Make it as easy as possible to voluntarily comply with liquor laws by providing educational training to licensees. C. Protect public safety by performing random controlled buys to increase compliance rate for the sale of alcohol to underage persons. D. Contribute to and protect the integrity of KDOR revenue streams by monitoring the filing and remittance of taxes on the sale of alcoholic beverages. Performance Measures
Division of VehiclesProgram HistoryOn July 1, 1972, the Division of Vehicles was moved from the State Highway Commission to the Department of Revenue. The Division administers Kansas law relating to vehicle titling and registration, motor vehicle dealer licensing, and the issuance, maintenance, and renewal of drivers' licenses.
Consequences of Not Funding this Program1) Violation of established federal and state statutes and regulations. 2) Unable to issue driver's license/identification cards. 3) Unable to track vehicle registrations, titles, and issue license plates. Program GoalsA. Provide exceptional service to customers, business partners, and stakeholders. Ensure information is presented in a consistent, efficient manner. Monitor business needs closely and adjust staffing to maintain quality service levels. B. Identify methods and technologies to improve efficiency for both internal and external customers, including county partners, lenders, and dealers. C. Adjust staffing to match business needs to decrease wait times in largest driver's license offices. Performance Measures
Property ValuationProgram HistoryThe Property Valuation Department became a division of the Department of Revenue under the executive reorganization of 1972 and provides overall supervision, training and education, assistance and support, and reporting for the Kansas ad valorem property tax system. The Director of Property Valuation has general supervision and direction of the county appraisers in the performance of their duties, and general supervision of the system of taxation throughout the state.
Consequences of Not Funding this Program1) Failure to maintain a uniform and equal basis of property taxation as required by the Kansas Constitution. 2) Loss of audit mechanisms to monitor compliance of the appraisal system with Kansas law. Program GoalsA. Provide counties, taxpayers, and staff with clear, useful, and accessible rules for valuing property. B. Provide education for county appraisers and officials, taxpayers, and staff regarding the valuation of property and other tax-related issues. Ensure that uniform and accurate valuations and assessments occur. C. Maintain the CAMA system and provide state and county personnel training on its use through training courses and workshops, in-depth procedural manuals, and user meetings to address and resolve system functionality issues. D. Conduct an annual independent review of county appraisal procedures to ensure compliance with Kansas laws, rules and regulations, and related policies. Performance Measures
Tax OperationsProgram HistoryIn 1972, the Division of Taxation was created within and as a part of the Department of Revenue. The Division, headed by the Director of Taxation, administers almost all state taxes, including individual and corporate income, retail sales and compensating use, mineral severance, motor fuel, cigarette, and alcoholic beverage excise taxes. The Division also administers the Homestead Property Tax and Food Sales Tax refunds. For local governments, the Division administers retail sales, compensating use, liquor excise, and transient guest taxes.
Consequences of Not Funding this Program1) All personal, corporate and business taxation, motor fuel tax, excise tax administration, and customer service would cease. 2) Delinquent tax debt would go unrecovered. No field presence would lead to an increase in non-compliance. 3) Increase in tax fraud. 4) No receiving and processing of tax returns. 5) Inability to process and distribute $9 billion to state and local entities, making Kansas government unable to function. 6) Loss of federal highway funding due to non-compliance with International Fuel Tax Agreement. Program GoalsA. Administer and enforce tax laws with integrity, fairness, and civility. B. Increase voluntary compliance with tax laws through educational opportunities and the application of strategic decision/risk management processes to support and effective discovery and collection programs. C. Reduce accounts receivable and ensure prompt resolution by applying the latest best practices and latest technology in automation. D. Enforce laws relating to the sale of cigarette and tobacco products. E. Continually use new technologies and systems to reduce paper-based processing. Performance Measures
Governmental Ethics CommissionAdministrationProgram HistoryThe Administration program ensures that fundamental operating costs of running an office (e.g., paying rent) are adequately addressed. This requirement is fundamental to the agency and originated with the agency in 1974.
Consequences of Not Funding this ProgramThe agency's other programs would not be sucessful, and certain tasks like paying bills could not be easily completed. Program GoalsA. To ensure that all reports receive a review of compliance with the law. B. To provide the necessary mandatory tools required to support other programs. Performance Measures
Education, Awareness, and ComplianceProgram HistoryThe goals of education, awareness, and compliance are fundamental to the Ethics Commission and therefore originated with the agency in 1974. The most significant legislation in recent years that affected this program was the extension of lobbying laws to include lobbying the executive branch, which occurred during the 2018 Legislature.
Consequences of Not Funding this ProgramNot funding this program would result in only using the enforcement arm of the Commission to encourage compliance with the laws, which is neither cost-efficient nor effective at obtaining voluntary legal compliance. Additionally, unintentional violations would proliferate as trainings would be eliminated. The consequences of not funding this program extend from allowing incorrect filings to fundamentally undermine the public's ability to trust government decision-making. Program GoalsA. To reduce the severity and number of unintentional violations of the Campaign Finance Act, lobbying, and ethics laws. B. To rapidly correct unintentional and non-severe violations of the Campaign Finance Act, lobbying, and ethics laws. Performance Measures
EnforcementProgram HistorySevere and intentional violations merit immediate referral to the enforcement arm of the Commission. Minor violations that are not adequately resolved require intervention by way of public hearings, fines, etc. The goals of enforcement are believed to have originated in the 1970s. The last significant alteration to statutory authority of the enforcement program is the authority to issue subpoenas, which was added in 1998.
Consequences of Not Funding this ProgramConsequences for violations of the campaign finance act, ethics laws, and lobbying laws would be eliminated. Violations would occur without investigation or penalty. While the Ethics Commission works to avoid the necessity of enforcement whenever reasonable and possible, the fact is that the enforcement arm of the agency is the only reason why some abide by the laws. Program GoalsA. To provide consequences for violations of the campaign finance, ethics, and lobbying laws in order to deter other violations. B. To adequately resolve violations of the campaign finance, ethics, and lobbying laws. C. To identify when violations have occurred of the campaign finance, ethics, and lobbying laws, as well as clearing referrals that are not violations. Performance Measures
Health Care StabilizationAdjudicationProgram HistoryThe Health Care Provider Insurance Availability Act, KSA 40-3401 et seq was enacted July 1, 1976. The Act was specifically cited by the KS Supreme Court in October 2012 in the case of Miller v. Johnson supporting the Legislature's authority to enact tort reforms.
Consequences of Not Funding this ProgramHealth Care Providers would not be properly represented, patients would not receive appropriate compensation, and the Board of Governors would likely be held in contempt of court. Program GoalsA. To assure appropriate representation and advocacy in the event of a claim against a health care provider. B. In the event the courts determine that an injured patient should be compensated, to assure the appropriate compensation is provided in a timely manner. Performance Measures
Medical Professional LiabilityProgram HistoryThe Health Care Provider Insurance Availability Act, KSA 40-3401 et seq was enacted July 1, 1976. The Act was specifically cited by the KS Supreme Court in October 2012 in the case of Miller v. Johnson supporting the Legislature's authority to enact tort reforms.
Consequences of Not Funding this ProgramPractitioners would not be able to be licensed to practice, which could result in individuals practicing without a violation or not practicing, leading to a sharp decrease in crucial services to the citizens of Kansas. Program GoalsA. To assure that all health care providers as defined in KSA 40-3401 and maintain adequate professional liability coverage as required by KSA 40-3402. Performance Measures
Hearing Instruments Board of ExaminersAdministrationProgram HistoryThe mission of the Board of Hearing Aid Examiners is to establish and enforce standards to ensure that the people of Kansas receive competent and ethical hearing aid care. The Board of Hearing Aid Examiners will act in accordance with a standard of conduct that will ensure efficient, productive, ethical and accountable actions. It is our obligation to approach this responsibility in a fair and logical manner. KSA 74-5801 establishes the Board of Hearing Aid Examiners for the purpose of regulating the practice of hearing aid dispensing in the State of Kansas.
Consequences of Not Funding this ProgramNo licensing of Hearing Aid Examiners. Performance Measures
Insurance DepartmentInsurance RegulationProgram HistoryThe Kansas Insurance Department was established by the Kansas Legislature in 1871. Chapter 40 of the Kansas Statutes Annotated bestow many complex duties and responsibilities upon the Commissioner of Insurance by granting the Commissioner sole supervision, control and regulation of the various individuals and entities authorized to transact the business of insurance in this state, including supervision over many of their business transactions. Insurance is not regulated at the federal level, so the Department has exclusive jurisdiction over the $22.2 billion business of insurance in Kansas.
Consequences of Not Funding this ProgramWithout company examination the chances of insurance company insolvencies would increase. Without monitoring rates and forms, insurance may not be affordable or accessible. Without licensure of individuals, corporations and associations, insurance policies could be written by unqualified or suspect individuals. Without regulation of the firefighter relief associations FRA funds may be misappropriated. Without regulation of the workers compensation program eligible workers compensation claims would not be paid. Program GoalsA. Protect the insurance consumers of Kansas through supervision, control and regulation of persons and organizations transacting the business of insurance in the state. B. To administer the Firefighter Relief Act. C. To administer the portion of the Workers Compensation Act for claims involving employers who are uninsured and unable to pay claims. Performance Measures
Securities RegulationProgram HistoryKansas was the first state to regulate the sale of securities for protection of its investor citizens and capital markets when the Kansas Securities Act was passed in 1911. According to J. N. Dolley (the Kansas Bank Commissioner at that time), it was intended to prevent the sale of securities by promoters who promised rain but delivered only "blue sky". During the next few years, several other states passed similar laws, and now all states have securities laws that are referred to as "Blue Sky" laws. The Kansas and other states' securities laws were enacted many years before the first federal Securities Act of 1933. The Kansas Securities Act was supplemented and refined many times since 1911 until enactment of the Kansas Uniform Securities Act (KUSA) in 2004 which became effective on July 1, 2005. The Securities Commissioner and staff also administer and enforce the Kansas Loan Broker's Act to regulate the services of loan brokers in Kansas who are not otherwise regulated or exempt.
Consequences of Not Funding this ProgramWithout funding to regulate capital formation and investment activity for the benefit of Kansas investors and businesses, extensive securities fraud and illegal or unethical conduct with significant financial damages would likely occur. Investor abuse and investment losses due to ignorance of best practice knowledge on investing and awareness of fraudulent schemes would likely increase and have significant financial impacts. Also, lack of funding could hamper support of prosecutions by the Attorney General and County and District Attorneys. Program GoalsA. To administer and enforce the registration and examination provisions of the Kansas Uniform Securities Act. B. To develop and implement investor education and protection initiatives to inform the public about investing in securities and protect the public from violations of the Kansas Uniform Securities Act. Performance Measures
Judicial CouncilAdministrationProgram HistoryThe Judicial Council was created by the Legislature in 1927 to improve the administration of justice in Kansas. With a small staff and through the use of advisory committees, the Judicial Council executes its statutory mission by recommending statutory enactments and amendments, conducting studies requested by the Legislature and Supreme Court, publishing important legal materials including the jury instructions used in all civil and criminal jury trials, and drafting and posting on the Judicial Council's website, legal forms for use by Kansas citizens. Beginning in fiscal year 2004, the Judicial Council became fully fee-funded.
Consequences of Not Funding this ProgramThe Kansas Judicial Council operates under one program to improve the administration of justice in Kansas. The consequences of not funding the Judicial Council would be (1) loss of an efficient and expert forum used by the Legislative and Judicial Branches to assemble stakeholders and reach consensus on complex bills and issues; (2) major statutory codes becoming outdated causing inefficiencies in the court process as well an an increase in workload for the Kansas legislative branch; (3) loss of access for Kansas citizens to free legal forms for use in Kansas courts; and (4) an inability to continue publication of the Judicial Council's five copyrighted books including the criminal jury instructions relied heavily on by judges, attorneys and law enforcement. Program GoalsA. To monitor major areas of law and corresponding statutory codes to identify needed updates or improvements. B. To publish and distribute legal materials for use in the Kansas court system. C. To create and post legal forms for use in the Kansas court system. Performance Measures
JudiciaryAppellate CourtsProgram HistoryJudicial authority ratified in the Kansas Constitution in 1859; last amended in 1972
Consequences of Not Funding this ProgramAll sub-programs are constitutionally or statutorily required: Supreme Court (Article III § 2), Court of Appeals (20-3001), Appellate Clerk (Article III § 4), Appellate Reporter (Article III § 4), Supreme Court Law Library (20-155), eCourt (20-1a20), Municipal Court Training and Judicial Recertification (12-4114) and Alternative Dispute Resolution (5-501). Program GoalsA. Provide Kansas residents with their fundamental right of access to justice. Performance Measures
District CourtsProgram HistoryJudicial authority ratified in the Kansas Constitution in 1859; last amended in 1972.
Consequences of Not Funding this ProgramSub-programs include: District Court Judges (constitutionally required - Article III § 6), District Court Employees (statutorily required - 20-361), CASA and CRB Programs (Kansas children remaining in court system), Court Improvement Federal Grants (noncompliance resulting in federal penalties), Correctional Supervision (statutorily required - 21-6607) and Child Support Enforcement (federally mandated). Program GoalsA. Provide Kansas residents with their fundamental right of access to justice. Performance Measures
Education ServicesProgram HistoryThe Judicial Branch education fund was established by the Kansas Legislature in 1992.
Consequences of Not Funding this ProgramStatutorily Required Program GoalsA. Providing quality training for judges and staff. Performance Measures
Information Services SupportProgram HistoryInformation Services (Data Processing) became a separate program in the Judicial Branch budget in 1985.
Consequences of Not Funding this ProgramEntire court system could not operate. Program GoalsA. Using information technology to improve efficiency and productivity through use of new and existing technology. Performance Measures
Judicial AdministrationProgram HistoryAdministrative authority ratified in the Kansas Constitution in 1859; last amended in 1972.
Consequences of Not Funding this ProgramConstitutional Requirement Program GoalsA. To implement the rules and policies of the Supreme Court as they apply to the operation and administration of the Judicial Branch. Performance Measures
Judicial and Professional ReviewProgram HistoryCommissions established constitutionally and statutorily from ratification in 1859 through 1973.
Consequences of Not Funding this ProgramSub-programs include: Judicial Qualifications (constitutionally required - Article III § 15), Nominating Commission (constitutionally and statutorily required - Article III § 5; 20-119 through 20-138), Law Examiners (statutorily required - 20-1a03) and Court Reporters (statutorily required - 20-912). Program GoalsA. Provide professional oversight for judges, attorneys and court reporters in Kansas. Kansas Corporation CommissionAdministration DivisionProgram HistoryThe Administrative Division consists of the Commissioners, its attorneys, front office support staff, public affairs, docket room, fiscal, human resources, and information technology staff. In 1883, the Board of Railroad Commissions was established by the Legislature, the Commissioners worked to ensure safe and reliable service for the public on the developing railroads. The Commission was charged with balancing the needs of Kansans and industry in reaching reasonable rates. At the time the Commission's role was primarily investigatory and advisory. As electricity and telephones became part of daily life, the 1911 Public Utilities Commission replaced the Railroad Commission. the role expanded to include the regulation of telephone service, water, light, heat and pipeline, and power companies. In 1920, the Court of Industrial Relations was created to combine regulatory duties with the arbitration of wages, hours, and industry and labor disputes. In 1925, it became the Public Service Commission. In 1933, the present regulatory State Corporation Commission was established. Today the Commission regulates the ever changing electric, natural gas, telecommunications, oil and gas, and transportation industries. KSA 74-606 requires the Commission main office to be located in Topeka and the conservation division in Wichita.
Consequences of Not Funding this ProgramFailure to fund the administrative functions of the agency would leave the agency without leadership or the ability to maintain the day-to-day operations. The agency would in essence be unable to regulate the industries charged with regulating, would lack staff to respond to the public and could not process and resolve legal issues, address budget, information technology or human resource issues. Program GoalsA. Protect the public interest by impartially, effectively, and efficiently regulating the rates, terms of serve, and safety of public utilities and commercial trucking, by regulating the production of crude oil and natural gas, and by promoting energy programs that improve energy efficiency in Kansas. B. Ensure due process in Commission proceedings and ensure compliance with applicable statutes, and regulations. C. To protect the public interest through fair, impartial, efficient and transparent legal resolution of all jurisdictional matters. D. Maintain all dockets for the agency and ensure timely filing of all documents within the dockets. E. Serve as resource for the legislative process by providing technical information to legislators, their staff, legislative committees in regard to subject matters under the agency's regulatory authority. F. Provide a streamlined process for public participation, education, and protection for the general public regarding regulatory issues. G. Implement programs and services to ensure a comprehensive and effective human resource effort for the KCC. H. Provide responsive, cost effective and efficient information technology services to the agency. I. Process all fiscal related transactions for the agency and provide support to the Divisions for purchases, travel and other fiscal related matters. Maintain financial integrity of the KCC. Performance Measures
Conservation DivisionProgram HistoryThe Commission has regulated the petroleum industry since 1933. General agency jurisdiction over oil and gas practices has remained stable for many decades; the agency shared some overlapping jurisdiction with KDHE during the 1970s through 1990s. Recent legislation impacting the division includes this session's merging of the well plugging assurance fund into the abandoned oil and gas well fund. KSA 74-606 requires the conservation division office to be located in Wichita. The Conservation Division is primarily funded by assessments and fees on the petroleum industry. The Division's main office is located in Wichita, with district offices in Chanute, Dodge City, Hays, and Wichita. Day-to-day Division activities include: permitting associated with wells and operator licenses; inspection and investigation of oil and gas leases, including wells, tank batteries, pits, and spills; enforcement of Commission regulations, and management of the abandoned well plugging program. *The KCC is required by statute to prevent degradation of land and water resources, prevent waste in the production of crude oil and natural gas resources, and protect correlative rights of mineral owners and royalty interest holders. It is difficult to derive relevant outcome measures for performance based budgeting purposes since outcomes have to be determined based on the current conditions for fact specific situations. Staff have to be able to review the data, facts, and conduct appropriate investigations without a predetermined outcome. Additionally, field staff must be able to respond quickly to protect environmental resources as well as land owner and operator rights. More details are provided in the agency budget and annual reports which provide more context around the goals, outcome and output measures contained here. Taking the information out of context may create inaccurate assumptions.
Consequences of Not Funding this ProgramThe KCC's Conservation Division regulates, enforces laws, and supervises activities associated with the exploration and production of oil and natural gas. Conservation staff works to prevent degradation of land and water resources, prevent waste in the production of crude oil and natural gas resources, and protect correlative rights of mineral owners and royalty interest holders. Without funding, most aspects of the oil and gas industry would be unregulated or cease to function in Kansas. Licenses to operate oil and gas wells could not be obtained, and current licensees would not be able to transfer and operate wells, or obtain permits to drill wells, plug wells, obtain injection authority to dispose of wastewater, to vent or flare current wells, or engage in compressed air energy storage operations. There would be no state oversight of on-lease spills of oil or brine water, wasteful oil and gas practices, the casing integrity of current oil, gas, and class II injection wells to ensure protection of fresh and usable water, or certain safety aspects of intra-state gas storage facilities. For Class II injection wells the Commission exercises delegated regulatory primacy over such wells, in conformity with the requirements mandated by federal regulations, without this delegated authority oversight would revert to the U.S. Environmetnal Protection Agency (EPA). Operators would be unable to obtain various severance tax exemptions. Abandoned wells with no responsible party would remain unplugged. Certain oil-and-gas related disputes would be unresolvable, as parties would be unable to exhaust administrative remedies before seeking court review. Fees and fines would not be collected or accrue to various funds, including the state general fund. Oil-and-gas related tax revenue would decline because the industry would be unable to fully function. Program GoalsA. Regulate, enforce laws, and supervises activities associated with the exploration and production of oil and gas to prevent degradation of land and water resources, prevent the waste in the production of crude oil and natural gas resources, and protect correlative rights of mineral owners and royalty interest holders. B. Timely reclaim and remediate land and water sources using allocated funds. Performance Measures
Energy DivisionProgram HistoryThe Kansas Energy Office (KEO) was created by statute in 1975, attached to the Governor's office. In 1978 the KEO was reorganized and given indepent status as a separate state agency. The Kanas Energy Office was then abolished in 1983 and its duties and responsibilities transferred to the Kansas Corporation Commission. (KSA 74-622) Pursuant to KSA 74-617 the KCC is authorized to receive federal funds. The KCC is specifically prohibited from adopting or enforcing energy efficiency standards for residential, commercial or industrial structures (KSA 66-1227). In 2000 the Kansas Legislature passed the Facility Conservation Improvement Program (FCIP) within the Department of Administration. The FCIP was moved to the KCC in 2007. The Division is completely funded by U.S. Department of Energy (DOE) federal funds and an annual grant application has to be approved by DOE to receive federal funds. All programs, goals and performance measures are established in compliance with the DOE grant requirements. DOE changed program metrics in 2019 and again in 2021. The Congressional Infrastructure Investment and Jobs Act if passed will have a direct effect on the Energy Division and may require modifications to programs, outcome measures and other DOE required metrics. The Division will be closely monitoring actions by Congress and will have to respond accordingly to all mandatory requirements.
Consequences of Not Funding this ProgramThis is a federal funded program through a U.S. Department of Energy formula grant, failure to continue to fund the program would reduce energy efficiency education and resources for K-12 teachers. Additionally, it would prevent the KCC from meeting the statutory requirements for the Energy Division. Program GoalsA. Increase energy conservation in small rural businesses and public buildings. B. Increase the number of schools participating in K-12 energy benchmarking activities. C. Expand energy efficiency education outreach (K-12, small business, and residential). This includes KidWind challenge participants. Performance Measures
Transportation DivisionProgram HistoryThe transportation division regulates motor carriers (MCs) and businesses that operate commercial motor vehicles in the state of Kansas. The Division is responsible for establishing the regulations that apply to motor carriers through both state statutes and administrative regulations, ensuring that businesses, drivers, and vehicles meet the appropriate economic and safety regulations to ensure the safety of the motoring public. This includes collaborations with other state and federal agencies with a close working relationship with the Kansas Highway Patrol. Although state regulation of public utilities existed in Kansas as far back as 1883, the Public Service Commission was not established until 1925. In 1933, the Kansas legislature replaced the Public Service Commission with the State Corporation Commission expanding its jurisdiction to include transportation. Transportation regulation was largely focused on enforcement of territories, rates and tariffs until deregulation occurred due to the Motor Carrier Act of 1980. The Transportation Division continues to regulate motor carriers today for issues related to safety and economic issues related to licensing and permitting, insurance and vehicle registration, among other things. The KCC is required by statute to balance the safety of the motoring public with the economic impact to motor carriers and ensure compliance with federal regulations, it is virtually impossible to derive relevant, meaningful, and realistic outcome measures for Staff's performance based budgeting purposes. Transportation staff have at the core of their mission the safety of the motoring public, it is hard to measure the number of accidents averted or lives saved by the work they do every day. More details are provided in the agency budget which provides more context around the goals, outcome and output measures contained herein. Taking this information out of context may create inaccurate assumptions.
Consequences of Not Funding this ProgramThis is an industry fee funded. To end the program funding would result in a much higher injury and fatality accident rate for the Kansas based motor carriers (MCs). This equates to a higher mortality rate for the motoring public. This would allow operators that are only concerned with their bottom line to operate with disregard for the safety of their employees and the general public. Additionally, Kansas would lose millions of dollars in interstate registration fees. Further, failing to fund this program would have a negative chain reaction in that funds currently transferred to the Kanas Highway Patrol to Kansas Department of Transportation, and all fines and penalties are transferred to the State General Fund would end. Program GoalsA. Reduce the number of accidents involving Kansas based carriers in comparison to carriers based in Midwest States. B. Reduce the number of conditional and unsatisfactory rated Kansas based carriers. C. Maintain high rate of compliance of Kansas based carriers with Unified Carrier Registration (UCR) requirements. Performance Measures
Utilities DivisionProgram HistoryThe KCC was originally established in 1883 to regulate railroad activity. Kansas was one of the first states to establish a regulatory agency and in 1911 the Legislature created a three member Public Utilities Commission (Commission). Over the years the Commission has regulated telegraph and telephone, pipeline, common carriers, water, electric, gas and other power companies with the exception of municipal owned utilities. The Utilities Division has four sections: Accounting and Financial Analysis responsible for investigating, analyzing and making recommendations to the Commission on accounting and financial issues relating to the electric, natural gas, telecommunication and water industries. The Economic Policy and Rates section is responsible for investigating and making recommendations on economic issues relating to the above industries. The Energy Operations and Pipeline Safety section provides technical expertise relating to electric utility operations, reliability, safety, electric transmission siting, and electric and gas consumer services. They also responsible to ensure safe operation of all gas utilities trough enforcement of federal and state regulations. The Telecommunications section is responsible for researching, investigating, analyzing, and making recommendations on courses of action for all telecommunications matters that come before the Commission. * Because the KCC is required by statute to balance the public need for adequate, efficient, and affordable service with a public utility's need for sufficient revenue, it is difficult to derive relevant outcome measures for Staff's performance based budgeting purpose since outcomes have to be determined on a case-by-case basis. Staff have to be able to review the data, facts, evidence and conduct investigations without a predetermined outcome. Staff's actions must be determined based on the merits of the issue. More details are provided in the agency budget which provides more context around the goals, outcome and output measures. Taking this information out of context may create inaccurate assumptions.
Consequences of Not Funding this ProgramFailure to fund would violate the KCC's Chapter 66 mandates to ensure utilities provide efficient and sufficient service at just and reasonable rates. Failure to fund would essentially leave the KCC'S current jurisdictional utilities unregulated, which would have profound impacts on rates as the agency would lack the resources to audit the utilities' rate increase requests and deprive the Commission of an evidentiary basis to establish rates. There is a high probability and risk that both residential and commercial rates could increase significantly, placing Kansas at an economic development disadvantage. Conversely, underfunding or not funding this program would allow a utility to have one class of customer, such as residential, subsidize another class, such as commercial or industrial, in order to create an economic incentive through lower rates to large customers, thereby increasing the utilities revenues. In addition, the KCC would be unable to evaluate and correct any deficiencies a utility might have in providing reliable service. Failure to fund the Energy Operations and Pipeline Safety could have dire effects on the environment and safety. Underfunding this section would hinder its ability to ensure safe operation of all gas utilities through enforcement of federal and state pipeline safety regulations. Failure to fund the Telecommunications section could dramatically impact the Kansas Universal Service Fund, customer service protections, and availability of telecommunication service. Program GoalsA. Ensure the laws and regulations applicable to jurisdictional electric, natural gas, telecommunications and water utilities are adhered to. B. Provide recommendations and advice to the Commission to promote and assure sufficient, efficient, and safe utility services at reasonable and non-discriminatory rates to consumers. C. Minimize the safety risk of natural gas pipeline operations throughout the State by assuring safe operation through compliance with regulations. Initiate action to educate operators to lower safety risk of natural gas system. D. Lower the risk to public safety by reducing excavator damages to pipelines. E. Protect the public interest through impartial, efficient, and transparent resolution of all jurisdictional issues through regulation and oversight of rates, services, and quality of service of jurisdictional telecommunications public utilities. Performance Measures
Kansas Dental BoardAdministrationProgram HistoryIn 1943, the Kansas Legislature passed the Dental Practices Act, KSA 65-1421 et seq. The Kansas Dental Board was established to enforce the Act, KSA 74-1404 et seq. The Board is composed of six dentists, two dental hygienists, and one public member, all of whom are appointed to four-year terms by the Governor.
Consequences of Not Funding this Program1) Licensing. Nonlicensed persons will practice dentistry and dental hygiene. Insurance companies and public safety net programs require licensure for reimbursement. 2) Legal. Ongoing practice of dentists and dental hygienists by unqualified or dangerous individuals. 3) Inspections. No capability to ensure sterilization and infection control standards are being met despite statewide, universal rules. Program GoalsA. License qualified candidates desiring to practice dentistry or dental hygiene in Kansas. B. Monitor compliance with sanitary and other regulations through routine sanitation inspections. C. Ensure safe dental practices by investigating complaints of incompetence, negligence, and illegal practice and revoking or suspending the licenses of practitioners engaging in negligent or illegal practice. Performance Measures
Kansas Human Rights CommissionComplianceProgram HistoryKansas Statutes Annotated 44-1004 provides the Kansas Human Rights Commission with the power to investigate complaints of discrimination based on race, color, ancestry, religion, sex, national origin, genetic testing (employment only), and disability, in the areas of employment, housing, and public accommodations. Effective January 1, 1992, the Commission was authorized to also investigate complaints of housing discrimination based upon familial status. The Kansas Age Discrimination in Employment Act (KSA 44-1111, et seq.) authorizes the Commission to investigate age-based employment discrimination complaints.
Consequences of Not Funding this ProgramDiscrimination, segregation or separation, and loss of equal opportunities in employment, housing, and public accommodations. Parties to the complaint do not have an administrative remedy to resolve allegations of discrimination. Program GoalsA. To provide prompt, professional and appropriate services to all citizens who contact the agency for assistance and maintain an effective and efficient complaint intake service to reduce or eliminate non-jurisdictional and frivolous complaints. B. To provide the opportunity for the early resolution through mediation of every complaint filed. C. On all cases not resolved by mediation, to conduct a prompt and thorough investigation of all allegations and to render a timely and appropriate determination that is supported by evidence of either probable cause or no probable cause in all cases submitted to Commissioners for such determination. Performance Measures
EducationProgram HistorySee Program History under the Compliance Program.
Consequences of Not Funding this ProgramIncreased discrimination and increased harassment. Loss of a training tool for employers, individuals, stakeholders, and other groups who want to address discrimination and prevent discrimination. Program GoalsA. Informs Kansans of what constitutes discrimination, the effects of unlawful discrimination, how to prevent discrimination, and provides an overview of discrimination laws. The public information program is the Commission's proactive effort to prevent future acts of discrimination. B. To maintain a statewide education program to inform all citizens on what constitutes discrimination, the effects of unlawful discrimination, how to prevent discrimination, and how to obtain redress. Performance Measures
Kansas LotteryExpanded LotteryProgram HistoryThe 2007 Legislature passed Senate Bill 66, the Kansas Expanded Lottery Act. The Act also allows for the Lottery, upon county voter approval, to operate lottery gaming facilities in four specific gaming zones. Casino gaming operations in the Southwest gaming zone (Boot Hill in Dodge City) commenced in December 2009. Casino gaming operations in the South Central gaming zone (Kansas Star in Mulvane) commenced on December 20, 2011. Casino gaming operations in the northeast gaming zone (Hollywood Casino in Kansas City) commenced on February 3, 2012. Casino gaming operations in the South East gaming zone (Kansas Crossing in Pittsbug) commenced on March 29, 2017.
Consequences of Not Funding this ProgramThe Lottery was established by statute and revenues from state operated casino gaming funds a number of state and local programs. Failure to adequately fund the program would lead to a decrease in available revenues for the state and local governments. Program GoalsA. Maintain public confidence in all casino gaming, and provide services that meet or exceed the expectations of the Kansas citizenry. B. Produce the greatest amount of revenue possible for the State of Kansas while ensuring the integrity of all games. Performance Measures
Traditional LotteryProgram HistoryIn November 1986, a constitutional amendment was approved by the Kansas voters authorizing a State Lottery. During the 1987 Legislative session, the State Legislature adopted the Lottery Act (the Act), and created the Kansas Lottery (the Lottery) as an independent component unit of the State of Kansas to operate lottery games. The Lottery was organized on March 19, 1987 and commenced administrative operations on May 21, 1987 but was strictly in the development stage through fiscal year 1987. Instant win tickets games began November 12, 1987. On February 2, 1988, the Lottery began participating in Lotto America, a multi-state draw game now called Powerball. In the current year, the Lottery offered several multi-state draw games (Powerball, Mega Millions, Lucky for Life, 2 by 2, and the new Lotto America), Kansas only draw games (Keno, Pick 3, Super Kansas Cash, Holiday Raffle and Racetrax) and instant scratch and pull-tab games.
Consequences of Not Funding this ProgramThe Lottery was established by statute and revenues from lottery sales fund a number of state programs. Failure to adequately fund the program would lead to a decrease in available revenues for the state. Program GoalsA. Maintain public confidence in all lottery products, and provide services that meet or exceed the expectations of the Kansas citizenry. B. Produce the greatest amount of revenue possible for the State of Kansas while ensuring the integrity of all games. Performance Measures
Kansas Public Employees Retirement SystemAdministrationProgram HistoryThe Kansas Public Employees Retirement System (KPERS) was created by an act of the 1961 Kansas Legislature. The Act provides that the purpose of the Retirement System is "...to provide an orderly means whereby employees of participating employers who obtain retirement age may be retired from active service without prejudice and without inflicting a hardship upon the employees retired and to enable such employees to accumulate reserves for themselves and their dependents to provide for old age, death, and termination of employment and for the purpose of effecting economy and efficiency in the administration of governmental affairs."
Consequences of Not Funding this ProgramKPERS administers the collection of employer and employee contributions, oversees the investment management of the KPERS Trust Fund and pays all benefits owed to KPERS members and their beneficiaries. Failure to fund the program would result in an inability for the agency to complete statutory required functions and ultimately be a breach of fiduciary duty to KPERS members. Program GoalsA. Pay all retirement benefits and death and disability benefits earned by KPERS members. B. Prudently manage the investments of the KPERS Trust Fund (pension plan) and group insurance reserve fund (death and disability plan). C. Collect all statutorily required employer and employee contributions to the pension plan and all statutorily required employer contributions to the death and disability plan. Performance Measures
Deferred CompensationProgram HistoryThe Kansas Deferred Compensation Plan is a voluntary, tax-deferred retirement savings program for state employees. In addition, many local public employers offer the plan to their employees. The Plan was administered by the Kansas Department of Administration and the Deferred Compensation Oversight Committee from 1980 to 2007.
Consequences of Not Funding this ProgramNot funding the deferred compensation plan would result in an inability for the agency to carry out the statutory required duty to administer the deferred compensation plan. Program GoalsA. Ensure that the plan is administered and operated according to its terms and to keep the plan compliant with federal as well as applicable state laws. B. Maintain control of fiduciary liability through governance, best practices, investment monitoring and fiduciary training. C. Increase the number of deferring employees. Performance Measures
Kansas Racing & Gaming CommissionExpanded Lottery Act Regulation ProgramProgram HistoryUnder KELA, the State of Kansas is authorized to contract with entities to operate casino-style games owned by the Kansas Lottery Commission. KELA established four gaming zones where lottery gaming facilities could be located and exclusively operated. Additionally, KELA provided that the Kansas Lottery Commission was authorized to contract with racetrack gaming facility managers in three of the four gaming zones to operate slots machines at pari-mutuel facilities.
Consequences of Not Funding this ProgramWithout this program there would be no regulatory oversight of gaming ownership and operations in Kansas Casinos. There would be no protection for Kansas citizens from the nefarious influences of the criminal element that had such a large impact on the early years of gaming in the United States. Additionally, the statutury requirements of KSA 74-8733 through 74-8773 would not be met. Program GoalsA. Uphold and promote the integrity of gaming at lottery and racetrack gaming facilities. B. Protect gaming operations from the influence of individuals or entities seeking to harm the integrity of gaming in Kansas. C. Protect the state of Kansas and its citizens from criminal activity and other potential issues related to the operation of lottery and racetrack gaming facilities. D. Investigate complaints and alleged violations of the KRGC rules and regulations and applicable state and federal laws. E. Coordinate with state agencies and local authorities to reduce and minimize illegal gaming in Kansas. F. Promote responsible gambling in the state of Kansas. Performance Measures
Racing RegulationProgram HistoryKSA 74-8804 (a) through (q) require the commission to observe and inspect all racetrack facilities; administer oaths and take depositions; examine any books, paper records or memoranda of any licensee, racetrack or business involved in simulcasting races to racetrack facilities in Kansas; issue subpoenas; allocate race meeting dates, racing days, and hours to all organization licensees; authority to exclude, or cause to be expelled from any race meeting or racetrack facility or to prohibit a licensee from conducting business with any person who has violated the provision of this act or any rule and regulation or order of the commission, been convicted of a violation of the racing or gambling laws or has been adjudicated of committing as a juvenile an act which if committed by an adult, would constitute such a violation, whose person reflects adversely on the honesty and integrity of horse or greyhound racing or interferes with the conduct of a race meeting; review and approve all proposed construction and major renovations to racetrack facilities; review and approve all proposed contracts with racetracks or businesses involved in simulcasting races to racetrack facilities in Kansas; suspend a horse or greyhound from participation in races; impose a civil fine; adopt rules and regulations and require fingerprinting and background information of all persons for employment, license or simulcasting license.
Consequences of Not Funding this ProgramCurrently, there are breeders of horses and greyhounds who continue to register their animals as Kansas bred. Not funding this program would result in their being no mechanism for these breeders to be able to register their animals as Kansas bred. The distinction can be important within the industry and not having this mechanism may have a negative impact on some breeders. Not funding this program would result in the loss of historical documents prior to their approved destruction. Program GoalsA. To maintain the integrity of pari-mutuel wagering systems and to protect the public and the health, safety and welfare of the racing animal. Tribal GamingProgram HistoryKSA 74-9801 through 74-9809 (a) mandate the agency shall be responsible for oversight, monitoring and compliance of class III gaming conducted pursuant to tribal-state compacts. It is the responsibility of the agency to monitor compliance with tribal-state gaming compacts and perform the duties of the state gaming agency as provided for in the tribal-state gaming compacts. The agency may examine and inspect all tribal gaming facilities and facilities linked to Kansas tribal gaming facilities for gaming, including but not limited to all machines and equipment used for tribal gaming, books, papers, records, electronic records, computer records or surveillance and security tapes and logs of any tribal gaming facility. The executive director may issue subpoenas. The agency can review all licensing and disciplinary actions and reports of noncompliance with the tribal-state compacts. Enforcement agents are vested with the power and authority of law enforcement officers.
Consequences of Not Funding this ProgramLack of regulation and oversight as required by the tribal-state gaming compacts, the Tribal Gaming Oversight Act, and the Indian Gaming Regulatory Act. Without this program there would be no agency to monitor compliance with tribal-state gaming compacts and no agency to perform the duties provided for in the tribal-state compacts. There would be no protection from criminal activity in the tribal gaming arena for Kansas and its citizens. Program GoalsA. Ensure compliance with the four tribal-state compacts and the Tribal Gaming Oversight Act and that gaming is conducted in accordance with said compacts and applicable state and federal laws. B. Protect the state of Kansas and its citizens from criminal activity in the Tribal gaming arena. C. Ensure accurate and complete information is provided to the different tribal gaming commissions for licensing purposes and to review all licensing decisions to ensure compliance. D. To conduct thorough background investigations on all gaming employees, management contractors, manufacturers and distributors of gaming devices seeking licensure at gaming facilities located in this state. E. Investigate any alleged violations of the tribal-state compacts and the Tribal Gaming Oversight Act. Performance Measures
Kansas Real Estate CommissionAdministrationProgram HistoryThe Kansas Real Estate Commission operates under the authority granted by KSA 74-4201 et seq. KSA 58-3034 et seq. prescribes licensing standards for real estate brokers and salespersons. KSA 58-30,101 et seq. governs brokerage relationships between real estate salespersons, brokers, and their clients and customers. Since 1949, the Kansas Real Estate Commission administers a program of licensure, education, and compliance relating to the transacting of real estate by salespersons and brokers in Kansas. The commission is composed of five members appointed by the Governor for staggered four-year terms. One member is appointed from each congressional district and one member from the state at large. At least three members shall have been real estate brokers for at least five years and at least one member shall have never been a real estate broker.
Consequences of Not Funding this ProgramReal estate licensure imposes important fiduciary duties meant to minimize the danger of financial harm: The duty to fully disclose all material facts to the client; a duty to fully disclose all purchase offers to sellers; a duty to handle client information and affairs with loyalty and confidentiality; and the duty to act honestly and in good faith, and without self-dealing and conflicts of interest. Foreseeable harms attendant to real estate transactions are primarily financial, although when a property sale involves a residence, personal risks can also arise. Foreseeable financial harms include, but are not limited to, purchase of properties that are noncompliant with local laws, have latent defects or that will otherwise necessitate considerable unanticipated expenses due to failure to understand the requirements or operation of state and local law, or failure of a contract to properly specify terms and conditions. Real estate requires considerable specialized knowledge. Applicants for real estate licenses must demonstrate proficiency in the principles and practices of the profession; state real estate and license law; professional standards; state agency law; real estate financing; real estate settlement procedures; escrow responsibilities; state record-keeping requirements; government regulations applicable to real estate; and a familiarity with state contract law. Program GoalsA. Licensing only those individuals who have successfully completed all pre-licensing and continuing education requirements required by Kansas law. B. Increasing licensees' knowledge of Kansas real estate law through education and outreach. C. Regulating real estate licensed activities to require compliance with commission statutes and regulations. Performance Measures
Legislative Division of Post AuditAdministrationProgram HistoryThe Legislative Post Audit Committee and the Legislative Division of Post Audit were established in 1971.
Consequences of Not Funding this ProgramThe Kansas Legislature would no longer have an office to audit state and local government if this program is not funded. Moreover, state law includes several specific audit requirements our office is required to perform. Those include a requirement that audit work be performed at each state agency at least every three years (KSA 46-1106), that audits be performed at the request of the Governor or any member or committee of the Legislature (KSA 46-1109), that information technology audits be done at the direction of the Post Audit Committee (KSA 46-1135), that a performance audit of KPERS be done at least once every three years (KSA 46-1136), and that a systematic and comprehensive evaluation of all economic development incentive programs be done every three years (KSA 46-1137). Program GoalsA. To conduct and issue audits that are responsive to the needs and mandates of the Legislature. B. To conduct audits that promote improved efficiency, effectiveness, and financial management practices in Kansas government. C. The agency will conduct audits in accordance with all applicable government auditing standards. Performance Measures
Legislative Research DepartmentAdministrationProgram HistoryThe Kansas Legislative Research Department (KLRD) is one of four nonpartisan agencies that provide support services for the Kansas Legislature. The Department has provided nonpartisan, objective research and fiscal analysis for the Kansas Legislature since 1934.
Consequences of Not Funding this ProgramReduce or eliminate the availability of nonpartisan information and policy options to legislators when deliberating on bills, hamper operations of legislative committees for the reception and distribution of information, negatively impact the development of the state annual budget via the appropriations bills, impede the development of biannual consensus revenue estimates, and require a separate nonpartisan entity to facilitate the redistricting process. Program GoalsA. Perform legislative research functions and other such duties as are directed by the Legislative Coordinating Council or by statute. B. Provide staff services to all special committees, select committees and standing committees when the Legislature is not in session. C. Collaborate with the Division of the Budget in the development of biannual consensus revenue estimates. D. Facilitate information sharing with the general public, and others with interest in the legislative process, legislative matters and the state budget. E. Coordinate, maintain, and report agency data and information as directed by committees or statute. Performance Measures
LegislatureAdministrationProgram HistoryThe Kansas Legislature consists of a 125-member House of Representatives and a 40-member Senate. Representatives are elected for a two-year term and Senators are elected for a four-year term. As prescribed in the Kansas Constitution, the Legislature convenes on the second Monday in January for an annual session and generally adjourns in early May. During the interim period, joint and special committees meet to discuss issues assigned to them by legislative leadership or by statute.
Consequences of Not Funding this ProgramLegislature: Inability to function as a representative government for the citizens of Kansas. If the Information Systems and Services of the Kansas Legislature are not maintained, functionality will eventually cease. Support will not be available to users on operation of applications and services resulting in issues with systems and services not being resolved causing the legislative processes to be interrupted and potentially cease. Program GoalsA. Operate as a representative form of government, utilizing committee system for participation in the legislative process. B. Appropriate funds and sufficient revenues to operate Kansas state government. C. Ensure continuous operation of all Information Systems and Services. Performance Measures
Office of Administrative HearingsDue Process HearingsProgram HistoryOn July 1, 1998, the OAH was established. Its original purpose was to conduct all adjudicative proceedings for the Kansas Department of Social and Rehabilitative Services (now the Department for Children and Families) pursuant to KSA 75-37,121. Six years later in 2004, KSA 77-561 and 77-562 authorized an independent OAH, phased in over time as the statute mandated, and took full effect on July 1, 2009.
Consequences of Not Funding this ProgramConstituents will be denied due process and a mechanism to contest the actions of state agencies determining their legal rights and in resolving other types of disputes lawfully. Program GoalsA. Deliver administrative due process for cases within timeframes specified by applicable law. B. Deliver administrative due process for parties efficiently and economically. Performance Measures
Office of Information Technology ServicesAdministrationProgram HistoryThe Office of Information Technology Services (OITS) was formerly known as the Division of Information Systems and Communications (DISC). This name change became effective in fall 2011. The history of the former organization began when the Division of Information Systems and Computing merged with the Telecommunications office on July 1, 1984 creating the Division of Information Systems and Communications. Newly available technologies had the potential to reduce unit costs for information processing and to provide the ability to perform functions never possible under a consolidated unit. The State realized the need to coordinate the infusion of new technologies to maximize its return on investment before replacement. The merger placed more authority over computer and communications plans with the Secretary of Administration without changing the responsibilities of the two organizations. KSA 75-4701 et seq. contains the original statutory legislation of the Division of Information Systems and Communications. Established in 1972, DISC centralized computer data processing for all state agencies except Board of Regents Institutions. In addition, it was responsible for approving the acquisition of data processing equipment for all state agencies, including Regents Institutions and developing computer programs for those state agencies wishing to contract for the service. The division operated without directly appropriated funds and relied on receipts derived from charges for services provided. In 1998, legislation (KSA 75-7201 et seq.) revised the State's approach to the governance of information technology. The bill created a Chief Information Technology Officer (CITO) for each branch of government, a Chief Information Technology Architect (CITA), and the Information Technology Executive Council (ITEC). The bill also established a $250,000 level for approval of information technology projects with oversight provided by the renamed and reconstituted Joint Committee on Information Technology (JCIT). In August 2011, the name of the Division of Information Systems and Communications was changed to the Office of Information Technology Services. The central mail service operation was transferred to the Department of Administration. In July 2018, the Office of Information Technology Services changed its agency number and separated from the Department of Administration.
Consequences of Not Funding this ProgramThe Office of Information Technology Services (OITS) serves as the enterprise level infrastructure for all state IT operations. OITS provides central oversight, management, security, and support of various critical IT operations, including the network, that state agencies utilize for their daily operations. If this program is not funded these functions would cease to exist for the state and would have severe operational and financial implications for the state and state agencies. While some functions can be replicated in each state agency through their IT divisions, the enterprise level knowledge, coordination, efficiencies, and economies of scale would be lost. Additionally, there are certain key and critical aspects that cannot be performed within an agency irrespective. Program GoalsA. Facilitates the strategic development of vision, mission and strategic roadmap for OITS. B. Ensures administrative and operational needs of OITS are met including human resources, finance, contract and vendor management, asset management, project management and agency communication. Performance Measures
Client ServicesProgram HistoryClient services encompasses several teams that provide a variety of information technology services to various agencies that fulfill statutory requirements for the State of Kansas. The user services team supports the environment, secure accessibility into the environment, and devices used by state employees to run mission critical applications. The Client Services department includes End-User Support Services including Executive Services, Consolidated IT Service Desk, and the IT Service Management (ITIL processes and ServiceNow Platform). These services are supported through inclusive rates across our three major lines of services and other hourly on-demand rates for those agencies not in a hosted environment.
Consequences of Not Funding this ProgramThe Office of Information Technology Services (OITS) serves as the enterprise level infrastructure for all state IT operations. OITS provides central oversight, management, security, and support of various critical IT operations, including the network, that state agencies utilize for their daily operations. If this program is not funded these functions would cease to exist for the state and would have severe operational and financial implications for the state and state agencies. While some functions can be replicated in each state agency through their IT divisions, the enterprise level knowledge, coordination, efficiencies, and economies of scale would be lost. Additionally, there are certain key and critical aspects that cannot be performed within an agency irrespective. Program GoalsA. Reduce customer wait time at OITS and across all agencies that use our services. B. Continue to support non-cabinet agencies with quality support. Performance Measures
Hosted ServicesProgram HistoryThe Hosted Services department provides both mainframe and data center hosting services to customers. Mainframe services are now contracted to a vendor that monitors maintenance, performance, information security, and allows for more predictable operation costs. The data center hosting service is hosted by a third party which has centralized most of the existing physical and virtual server environments into a secure environment. The data center hosted facilities provides managed services for state agencies. This partnership greatly reduces the risk the State incurs due to outdated data center facilities, aged server and storage hardware, and provides a redundant disaster recovery solution for critical agency applications. The hosted environment provides an improved attention to hardware and system maintenance, reliability and performance of State applications, and an improved information security posture for the State. Services provided by the vendor are consumption based and will provide a predictable cost model for the service. This partnership also provides a backup solution for data recovery, provides stable, reliable, and highly available data storage and retrieval, and provides 24x7 monitoring of the environment. It includes hardware, virtual machine(s), server operating system(s), and all associated support and administration. OITS continues to provide a small Topeka located data center facilities, primarily located in the Eisenhower State Office Building as needed. All services have consolidated service desk and security monitoring services.
Consequences of Not Funding this ProgramThe Office of Information Technology Services (OITS) serves as the enterprise level infrastructure for all state IT operations. OITS provides central oversight, management, security, and support of various critical IT operations, including the network, that state agencies utilize for their daily operations. If this program is not funded these functions would cease to exist for the state and would have severe operational and financial implications for the state and state agencies. While some functions can be replicated in each state agency through their IT divisions, the enterprise level knowledge, coordination, efficiencies, and economies of scale would be lost. Additionally, there are certain key and critical aspects that cannot be performed within an agency irrespective. Program GoalsA. Provide secure, standardized, and redundant mainframe services for Executive branch Agency customers through a partner solution. B. Provide secure, standardized, and redundant managed data center services for Executive branch Agency customers through a partner solution. C. Provide secure and standardized data center hosting services for State of Kansas Agency customers in the Eisenhower State Office Building. D. Provide standardized Microsoft Azure public cloud guidance and support for Executive branch Agency customers. Performance Measures
KISOProgram HistoryIn 2018, the Kansas Legislature passed K.S.A 75-7236 through 75-7243, which is known as the Kansas Cybersecurity Act (KCA). The KCA formally created the position of the Chief Information Security Officer and identified the positions duties. The KCA also created the Kansas Information Security Office and outlined its powers and duties. The KISO program provides enterprise security services, security consulting services, information security officer services, and technical security services across all OITS service offerings including hosted services, business productivity tools, and telecommunication services. Security information, resources, tools, and training are provided to all executive branch agencies including policy development, risk assessment, compliance management, disaster recovery and business continuity plan development, and cyber incident management and response plan development. Technical security management services include configuration management, engineering, scanning, continuous monitoring, and reporting.
Consequences of Not Funding this ProgramThe Office of Information Technology Services (OITS) serves as the enterprise level infrastructure for all state IT operations. OITS provides central oversight, management, security, and support of various critical IT operations, including the network, that state agencies utilize for their daily operations. If this program is not funded these functions would cease to exist for the state and would have severe operational and financial implications for the state and state agencies. While some functions can be replicated in each state agency through their IT divisions, the enterprise level knowledge, coordination, efficiencies, and economies of scale would be lost. Additionally, there are certain key and critical aspects that cannot be performed within an agency irrespective. Program GoalsA. Continue to ensure KISO staff is prepared for and can quickly response to critical events to ensure that they do not become full blown cybersecurity incidents. B. Continue to drive a cybersecurity aware culture among State of Kansas Employee through various education and awareness campaigns. These efforts will ultimately culminate in a lower risk to the State of Kansas by reducing employee susceptibility to phishing attacks. C. Continue to raise awareness of cybersecurity standards and practices to raise the State of Kansas cyber hygiene. The results of the efforts will lead to a better cyber risk rating. Performance Measures
KITOProgram HistoryThe Kansas Information Technology Office supports the statutory responsibilities of the Executive, Judicial, and Legislative Branch Chief Information Technology Officers (CITOs) and the Chief Information Technology Architect (CITA). It provides oversight of information technology projects as outlined in statute, ITEC policies, and JCIT guidelines and recommendations. Consultation services are available for major IT projects throughout Kansas government, and KITO administers the project management training program which includes the certification program for the State of Kansas project management methodology.
Consequences of Not Funding this ProgramThe Office of Information Technology Services (OITS) serves as the enterprise level infrastructure for all state IT operations. OITS provides central oversight, management, security, and support of various critical IT operations, including the network, that state agencies utilize for their daily operations. If this program is not funded these functions would cease to exist for the state and would have severe operational and financial implications for the state and state agencies. While some functions can be replicated in each state agency through their IT divisions, the enterprise level knowledge, coordination, efficiencies, and economies of scale would be lost. Additionally, there are certain key and critical aspects that cannot be performed within an agency irrespective. Executive, Judicial and Legislative CITOs would require alternative processes to fulfill statutory responsibilities for the collection of project information pursuant to KSA 75-7209. Program GoalsA. Review project submissions for completeness and facilitate CITO review/approval within 20 days of agency submission. B. Promote Project Management best practices by facilitating regular offerings of the Kansas Project Management Methodology Certification class and by supporting participants throughout the certification process. C. Promote and provide training for the Accessibility Management Platform (AMP) for agency use when modifying a website. Performance Measures
O365Program HistoryOITS has migrated to the email and collaboration platform known as Office 365 (O365) hosted by Microsoft. This upgrade provided a secure multi-tenant solution built to comply with government security requirements. This service replaced the Exchange Email service and other email systems that operated independently in each agency in most cases. Some agencies still provide their own legacy Microsoft email services or are in their own O365 tenant not managed by OITS. The O365 solution provides predictable costs, email and business data capabilities that is secured in multiple data centers across the U.S., and a fully redundant hosted solution.
Consequences of Not Funding this ProgramThe Office of Information Technology Services (OITS) serves as the enterprise level infrastructure for all state IT operations. OITS provides central oversight, management, security, and support of various critical IT operations, including the network, that state agencies utilize for their daily operations. If this program is not funded these functions would cease to exist for the state and would have severe operational and financial implications for the state and state agencies. While some functions can be replicated in each state agency through their IT divisions, the enterprise level knowledge, coordination, efficiencies, and economies of scale would be lost. Additionally, there are certain key and critical aspects that cannot be performed within an agency irrespective. Program GoalsA. Provide secure, standardized, and redundant email services for Executive branch Agency customers. B. Provide secure, standardized, and redundant collaboration services (Teams/SharePoint) for Executive branch Agency customers. C. Provide standardized email and collaboration feature set for Executive branch Agency customers. Performance Measures
TelecommProgram HistoryThe Network and Telecommunications group operates the Kansas Wide-area Information Network (KanWIN), the single largest IP network in the State of Kansas, ensuring 24/7 monitoring and response capabilities, as well as the routine planning, expansion, repair, and maintenance of the State's primary network. This network provides service to all three branches of government through 17,000 data jacks at more than 1,500 locations statewide. The group also supports wireless connectivity at more than 60 locations statewide. Additionally, OITS supports more than 10,000 voice handsets throughout state offices and call centers and also provides Domain Name Services for ks.gov, Kansas.gov, and more than 50 other domains throughout the State.
Consequences of Not Funding this ProgramThe Office of Information Technology Services (OITS) serves as the enterprise level infrastructure for all state IT operations. OITS provides central oversight, management, security, and support of various critical IT operations, including the network, that state agencies utilize for their daily operations. If this program is not funded these functions would cease to exist for the state and would have severe operational and financial implications for the state and state agencies. While some functions can be replicated in each state agency through their IT divisions, the enterprise level knowledge, coordination, efficiencies, and economies of scale would be lost. Additionally, there are certain key and critical aspects that cannot be performed within an agency irrespective. Program GoalsA. Provide secure, standardized, and redundant local, metro, and wide area network (LAN, MAN, WAN) services for State of Kansas Agency customers. B. Provide standardized network circuits across the State of Kansas to allow for secured communication between Agency customers. C. Provide secure, standardized, and redundant voice over IP telephone services for State of Kansas Agency customers. Performance Measures
Office of the GovernorGrants OfficeProgram HistoryThe KGGP was established in 2003 to consolidate and coordinate the administration of crime victim assistance and criminal justice improvement funding. In doing so, the grant management of these types of programs was streamlined and increased technical assistance provided for state, tribal, county, and local subgrantees.
Consequences of Not Funding this ProgramThe Office of Recovery serves to ensure the state is maximizing the federal relief dollars with federal compliance, allowability, and reporting guidelines. The State increases its risk significantly without the oversight and management from the Office of Recovery. Program GoalsA. The KGGP strategic goal is to prioritize funding to applicants demonstrating the guiding principle of a criminal justice system and victimcentered "whole community" approach to services that enhances accountability across systems. The whole community approach centers on developing accessible, evidence-based trauma-informed, culturally effective, and equitable services. The strategies to address this goal are (1) leverage service through coordination and collaboration among agencies; (2) enhance services within the agency; and (3) engage and empower through training and awareness. The KGGP meets this goal by providing grant management, reporting, technical assistance, and compliance training to subrecipients receiving grant funds. Performance Measures
Office of RecoveryProgram HistoryThe Office of Recovery was established in June 2020 in response to the gobal COVID-19 pandemic in an effort to manage the federal relief dollars coming into the state. The Office of Recovery's mission and purpose is to deliver maximum impact with COVID-19 relief funding for Kansans. The Office of Recovery has purview over various COVID-19 relief funding for Kansas funding such as ARPA, CARES Act, CRF, CAA, HR133, etc.
Consequences of Not Funding this ProgramThe Office of Recovery serves to ensure the state is maximizing the federal relief dollars with federal compliance, allowability, and reporting guidelines. The State increases its risk significantly without the oversight and management from the Office of Recovery. Program GoalsA. Providing transparency through timely and accurate communication. B. Utilizing key controls to ensure compliance with federal requirements, compliance and reporting. C. To provide appropriate guidance and support for minimized findings on external audits while ensuring compliance with statutory deadlines. Performance Measures
Office of the State Bank CommissionerConsumer Mortgage Lending ProgramProgram HistoryThe Consumer and Mortgage Lending (CML) program oversees and supervises consumer credit lenders; mortgage lenders, servicers, and brokers; money transmitters, debt management companies, sales finance companies, and other credit providers. The CML Division administers the Uniform Consumer Credit Code, the Kansas Mortgage Business Act, Credit Services Organization Act, as well as Federal Regulation Z, RESPA, Regulation M, Fair Debt Collection Practices Act, Fair Credit Reporting Act, Equal Credit Opportunity Act, and other applicable federal laws and regulations.
Consequences of Not Funding this ProgramKansas consumers would not have protections such as clear terms, compliant rates/fees, as intended by the legislation that enacted the laws. If the program is not funded, licenses would not be issued and thus examinations not performed. This may lead to contract issues, fraud, and other harmful acts toward consumers. Program GoalsA. Conduct periodic examinations of regulated entities. B. Promote lawful business practices by informing licensees of their compliance responsibilities. Performance Measures
State Banking & Trust RegulationProgram HistoryAuthority for this program and the powers of the OSBC were established in KSA 9-101 et seq, in 1891 to regulate and examine all financial institutions. The regulation of savings and loan associations, credit unions, and securities activities was later removed. Authority for the OSBC is found in KSA 75-1304 et seq., while the State Banking Board is authorized by KSA 74-3004 et seq.
Consequences of Not Funding this ProgramThere would not be appropriate regulation of state-chartered banking institutions which may cause financial harm to Kansas consumers and business. Federal regulators would still conduct examinations; however, the result would be potential loss of loans and deposits of Kansas state-chartered institutions and the conversion of banking and trust entities to national charters so appropriate regulation could be achieved. Program GoalsA. Maintain independent examination turnaround time at 30 days or less. B. Maintain Conference of State Bank Supervisor's (CSBS) accreditation. C. Review, evaluate, and adjust hybrid examination protocol for optimal efficiency. Performance Measures
Technology Enabled Fiduciary Financial Institutions (TEFFI)Program HistoryThe TEFFI bill was introduced to the Kansas Legislature during the 2021 legislative session. Senate Sub for HB 2074 was passed overwhelmingly in both the House and Senate. No program history exists as this is the first business of this kind, i.e., no other TEFFIs are in existence. For this reason, Outcome Measures and Output Measures have not yet been developed. Outcome Measures and Output Measures will be adopted as the TEFFI program gets closer to and into transactional operation.
Consequences of Not Funding this ProgramFailure to fund the TEFFI Program would violate the Technology-Enabled Fiduciary Financial Institutions Act, KSA 9-2301 et seq. 2022 Senate Bill 337 was effective March 10, 2022, and 2022 House Bill 2489 was effective July 1, 2022. Failure to fund would also void the completion of the TEFFI business model and eliminate Kansas' position as the only state in the union authorizing TEFFI's. Program GoalsA. Evaluate rules and regulations to properly regulate TEFFI entities and amend as needed. B. Develop examination processes and procedures to assess the operating condition of a TEFFI. C. Conduct examinations to assess IT, BSA, and statute compliance. Pooled Money Investment BoardAdministrationProgram HistoryThe Program History of the PMIB is outlined in very specific detail in the DA-400 Budget Narrative.
Consequences of Not Funding this ProgramThe Pooled Money Investment Board (PMIB) and its authority are established under the State Moneys Law, KSA 75-4201 et. seq. The PMIB manages the investable state money available from the State General Fund and the hundreds of other individual state agency funds received by the State Treasurer's Office. The PMIB also provides investment management services for individual state agencies with statutorily authorized investment authority. The PMIB is the only entity within the State system charged with this responsibility. The PMIB's Budget is entirely FEE FUNDED and any fees collected above the annual budget are transferred to the State General Fund. Program GoalsA. The Pooled Money Investment Board (PMIB) aspires to be a premier financial services organization; serving both the citizens and the State of Kansas through professionalism, integrity, and efficiency. The PMIB strives to maximize the return on those resources entrusted to our care while remaining steadfast to our primary objectives of safety and liquidity. Performance Measures
Real Estate Appraisal BoardAdministrationProgram HistoryThe Kansas State Certified and Licensed Real Property Appraisers Act became effective on April 19, 1990. The act established the Kansas Real Estate Appraisal Board and provided for the licensure and certification of real estate appraisers. Under KSA 58-4121, the act requires all state certified and licensed appraisers to comply with the Uniform Standards of Professional Appraisal Practice promulgated pursuant to federal law.
Consequences of Not Funding this ProgramIf administration is not funded, the agency would not be able to license appraisers to do Federally Related Real Estate Appraisals in KS. The KREAB Board will be reviewing renewal fees for both AMC's and Appraisers in FY-2023. It is anticipated both will be increased. Program GoalsA. Maintaining and/or processing any changes to statues or regulations to ensure that the Kansas Appraisal Program is in compliance with the Appraisal Subcommittee (ASC) requirements. B. Continue to work diligently to get complaints processed in the one-year timeframe mandated by the ASC. C. Completing the transition to the new data base and work with Appraisers, AMC's and Education Providers to assist them in using it. D. Continue to maintain excellent reviews conducted by the ASC. Performance Measures
Revisor of StatutesAdministrationProgram HistoryThe Office of Revisor of Statutes was created in 1929 by the Kansas Legislature. The current statute governing the office was enacted in 1971 and is codified at KSA 46-1211. The Revisor of Statutes is appointed by and serves under the direction of the Legislative Coordinating Council. The Office of Revisor of Statutes is a nonpartisan, legal agency that serves the members of the Kansas Legislature regardless of political affiliation. Legislative documents prepared by the office are drafted in an unbiased, professional manner for all legislators. All Revisors are attorneys licensed to practice law in the State of Kansas. Revisors provide drafting services and legal advice and consultation at the request of individual legislators and legislative committees.
Consequences of Not Funding this ProgramThe Legislature would not be provided legal services including the drafting of essential legislative documents to facilitate the operation of the legislature and not be provided relevant legal advice and consultation. Additionally, the compilation and publication of the laws of Kansas would not be completed as required by law. Program GoalsA. Drafting bills, amendments, committee reports, resolutions and other legislative documents; staffing legislative committees; and providing legal advice and consultation, and researching legal questions and issues on legislative matters pursuant to statute, or as directed by members of the Legislature or the Legislative Coordinating Council. The performance measure with this program objective is the preparation of specified legal documents to the highest professional standards of competency consistent within the time restrictions for their preparation placed on the office by legislative requirements. Performance would be measured by whether the legislative imposed deadlines are met and the level of technical accuracy in the drafting. This performance objective relates to providing competent professional legal services to the legislature as required by law and legislative directives. B. Compiling, editing, indexing and publishing Kansas Statutes Annotated and annual supplements. This performance objective centers on the office's responsibility in compiling, editing, indexing and publishing the general laws of the state in the Kansas Statutes Annotated and annual supplements. Performance objectives would be measured according to publication of the volumes according to set goals of publication and accuracy of the publication work. Performance Measures
Secretary of StateAdministration (ADM)Program HistoryThe Administration Program consists of four divisions: administration, publications, legal services and information technology. This program provides critical functions for this agency including, payroll; financial transactions; official publications including the Kansas Register, Kansas Administrative Rules and Regulations, and the Session Laws of Kansas; legal review and retention schedules; IT operations and the AS 400 computer migration.
Consequences of Not Funding this ProgramThe Administration Program would not be able to fulfill its statutory responsibilities if the program was not funded. Program GoalsA. Document retention updates to ensure records are accurately and appropriately filed and to improve record modernization and maintenance (record filing modernization). B. Migration off the AS400 operating system by FY 2024. C. Establish an online store on the agency website for constituents to order publications, Kansas flags, and obtain other services from the agency. D. Establish an electronic regulations process to improve speed and transparency of the regulatory process. E. Produce a full set of Kansas Administrative Rules & Regulations in FY2022. Performance Measures
Business Services (BS)Program HistoryThe Business Services Division is primarily responsible for administering filings for Kansas business entities and the Uniform Commercial Code (UCC) and places a high value on delivering outstanding customer service. Business Services files formation, annual report, and amendment documents for corporations, limited liability companies, limited partnerships, limited liability partnerships, cooperatives, business trusts and other entities. The Division also maintains records on active, forfeited, withdrawn, merged, canceled, and dissolved business entities. In FY 2023, approximately 295,000 business documents were filed with the division, of which more than 221,000 were annual reports. Migration off the AS 400 computer system, along with legislation approved in 2023, will streamline business filings and make it possible to file more types of filings online. The agency anticipates promotion of the new business entity filing system over the next two years through organizations, mailings, and social media.
Consequences of Not Funding this ProgramThe Business Services Division would not be able to fulfill its statutory requirement to file business formation and related business filings if the program was not funded. Program GoalsA. In FY 2020, approximately 25% of business entity filings could be filed online. The agency is developing and plans to implement a new business entity filing system that will enable additional filings to be submitted online. The agency has a goal of achieving any necessary legislative, regulatory, and internal policy adjustments to enable at least 80% of filings to be able to be submitted online by the end of FY 2023. With additional legislative changes the agency anticipates 80% of this goal will be achieved by end of FY 2024. B. The agency has a goal to increase customer use of the existing online business services filing system. Currently, most business formation documents can be filed online. In FY 2019, 73% of business formation documents were filed online. In general, online filing has increased from year to year. The agency has a goal to increase online filing to 80% by the end of FY 2022. For FY 2021, the agency exceeded its goal of 78% of business formation documents filed online by the end of FY 21. Therefore, the agency is revising this goal to further increase online formation filings to 83% in FY 23. C. The agency has a goal to increase customer use of the existing online business services filing system. Currently, most annual reports can be filed online. In FY 2019, 74% of annual reports were filed online. In general, online filing has increased from year to year. The agency has a goal to increase online filing to 80% by the end of FY 2022. In FY 2021, the agency met its FY 22 goal of 80% of annual reports filed online. Therefore, the agency is revising this goal to further increase online annual report filings to 85% in FY 23. Performance Measures
Elections (ELM)Program HistoryThe Elections Division is primarily responsible for overseeing national and state elections, candidate filings for national and state offices, and assisting local election officers administer elections. In 2023, legislation was passed to update and streamline election statutes and clarify conflicting statutes with a goal of improving election administration and further increasing transparency in the election process. The division is also responsible for lobbyist registrations, issuing lobbying badges, providing public access to state campaign finance documents and public disclosure documents, implementing federal legislation pertaining to election administration, and selling Kansas flags. The Division also serves as a repository for statements of substantial interest for state officers and certain state employees. The Division places high importance on excellent customer service and ensuring the administration and integrity of elections.
Consequences of Not Funding this ProgramThe Elections Division would not be able to fulfill its statutory requirements if the program was not funded. Program GoalsA. Increase electronic filings of statement of substantial interests [SSI] forms. Current law does not require individuals to file SSI's electronically. Filing SSIs electronically streamlines the process and allows for efficient public access of these documents. In FY 2021, approximately 90% of SSIs were filed electronically. This is not a significant change from FY 2020. The agency anticipated a 95% electronic filing rate by the end of FY 2022 and exceeded that goal with 97% filing online. The agency anticipates a 100% filing rate by the end of FY 2023. In future years, the agency will work to maintain this goal as new filers use the system. B. Increase electronic filing of campaign finance reports for state officeholders and candidates for state office. Current law only requires candidates for statewide office to file electronically. Electronic filing of campaign finance reduces the amount of time and resources needed to provide services to the public and modernizes the process. In FY 2021, 40% of all candidates filed campaign finance reports electronically. The agency has a goal to increase electronic campaign finance report filings to 55% by the end of FY 2022. The agency exceeded this goal in FY 2022 with 76^ of filings submitted electronically. As a result, the agency has adjusted its goal from 75% to 80% by the end of FY 2023. Migrating off the AS400 computer system will enable the agency to redesign and improve the user experience of the campaign finance system, which is anticipated to occur once the new system is implemented. The agency estimates that 90% of filings will be filed electronically once a new system is implemented. Performance Measures
Help America Vote Act (HAVA)Program HistoryThe Help America Vote Act (HAVA) Program is administered by the Elections Division. The Help American Vote Act [HAVA] of 2002 created new mandatory minimum standards for states to follow in the several key areas of election administration. These areas included provisional voting, providing voting information to the public, updating and upgrading voting equipment, creating a statewide list of registered voters, creating a process to file administrative complaints, and developing voter identification procedures. Since 2002, Kansas has accomplished the following objectives under HAVA:
Consequences of Not Funding this ProgramFunctions of the HAVA program are essential to the administration of elections by the State of Kansas. The HAVA program would not be able to fulfill its requirements if the program was not funded. Program GoalsA. The agency has a goal to purchase cyber security services within the HAVA program for counties statewide. The state, in coordination with a private vendor, worked with counties to enhance existing security profiles and network security. Due to COVID-19, the agency had to delay implementation of this goal for FY 2020. The agency had a 50% completion rate in FY 2021 and met its 100% completion goal by the end of FY 2022. Continued efforts for maintenance will likely continue in FY 2023 and FY 2024. B. The agency has a goal to ensure the security of voting equipment across the state within the HAVA program. The agency has a goal to work with counties to ensure paper trail ballots for voting equipment in the state. The agency achieved a 100% completion rate by the end of FY 2022. C. In FY 2021, the agency has a goal to continue its coordination with the National Guard and Department of Homeland Security to provide virtual statewide security training to all county election officials. Approximately 98% of county election officials participated by the end of FY 2021. The agency has a goal to continue training with 100% completion by the end of FY 2022. The agency is reviewing this training and will implement a cybersecurity training program with 100% expected participation in FY 2024. D. The agency has a goal to implement a new training program for all 105 county election officers specifically for the administration of elections. KSA 25-124 requires the Secretary of State to provide instruction to county election officers in a method determined by the Secretary of State. This program is in addition to other mandated annual training for local election offices. The goal is to have at least one certified election official in every county prior to the 2024 General Election. Performance Measures
State TreasurerABLEProgram History2015 Legislature created the Achieving a Better Life Experience savings program with H.B. 2215. This program is based on a new federal statute which allows individuals diagnosed with a disability before the age of 26 to save in accounts that they own with tax deferred growth and tax free withdraw of earnings used for qualified expenses related to their disability under section 529A of the Internal Revenue Code.
Consequences of Not Funding this ProgramNo state oversight of the program manager contract to include plan design, performance management, and marketing. Failure to fund would lead to the end of the ABLE Savings program for the disabled in Kansas. Program GoalsA. Continue partnership with the multi-state consortium to expand the Kansas Achieving a Better Life Experience (ABLE) Savings Program. B. Continue to increase awareness of the role an ABLE account can play in the lives of Kansans living with a disability. C. Identify and implement efficiencies that align with the federal treasury regulations and to increase accessibility to the program by the disability community and their families. Performance Measures
AdministrationProgram HistoryThis program is responsible for the overall management and direction of all activities of the State Treasurer's office. Administration establishes policy, assigns and directs the work of the other operating programs, determines priorities, allocates available resources on the basis of those priorities, and requires internal reviews of operations and procedures. Management functions performed or delegated by this program include personnel and payroll issues, budgeting, administrative correspondence, and the collating and distributing of management information to other state agencies and other interested parties. The State Treasurer is a member of the Pooled Money Investment Board, and as of July 1, 1993, a board trustee of the Kansas Public Employees Retirement System. The administrative staff provides general office support for all areas in the Treasurer's Office. General office support services include telephone and fax communication support supplies, purchasing, and accounts payable. Treasurer Lynn Rogers, who took office in January 2021, devotes time and resources assisting citizens throughout Kansas to know and understand the programs in the Treasurer's office which could be beneficial for them.
Consequences of Not Funding this ProgramThe office would not be able to administer and provide support for designated programs. Lack of funding would impact the ability to support and maintain Treasurer data processing applications used by internal users, external users, and trusted third parties, including critical state banking functions. It would also greatly impact the ability to support and maintain central data processing applications hosted for other state agencies including the Kansas Debt Recovery System (KDRS), Kansas Treasury Offset Program (KTOP), and Kansas Municipal Investment Pool (KMIP) resulting in the potential loss of millions of dollars in state revenue collected through debt recovery. Program GoalsA. Provide leadership to the agency through establishing priorities and policies, properly allocating available resources, and evaluating performance. B. Promote the responsible management of state finances and increase government transparency. C. Increase awareness of office services to the public through digital and traditional marketing efforts, coordinated virtual and in-person events, and participation in community events. D. Provide for efficient, cost-effective data processing for the specific banking functions and programs for the Treasurer's Office. Make sure the financial needs of all state agencies can be met. Plan for continuity of operations in the event in a disruption of service. Performance Measures
Administration: Systems Designed/Maintained for Other AgenciesPerformance Measures
Administration: Systems Designed/Maintained for Treasurer's OfficePerformance Measures
Bond ServicesProgram HistoryThe Municipal Bond Services program is responsible for the registration of all municipal bonds issued in the State. In addition, this program provides registrar and paying agent services for the majority of all local municipal bond issues, as well as state issues. The State Treasurer was named fiscal agent for the State of Kansas in 1908. With the enactment of 1982 PL 97-248, the Tax Equity and Fiscal Responsibility Act (TEFRA) requiring municipal obligations issued after June 30, 1983, to be in registered form, legislation was passed enabling municipalities to issue registered bonds (KSA 10-103).
Consequences of Not Funding this ProgramWould impact the ability to perform the statutory duty to determine the sufficiency of transcripts and to register bonds in the municipal bonds register resulting in the lack of a consolidated record and a complete picture of the state's bond indebtedness. Lack of bond registry could prevent future issuances of municipal bonds. Program GoalsA. To register all municipal bonds and temporary notes issued in the State of Kansas in a timely and accurate manner per KSA 10-108. B. To compile and have published the annual indebtedness report by September 30th per KSA 10-1007a. C. To perform paying agent services on Kansas municipal bonds and temporary notes. D. To develop employee skills and professional skills for a stronger team. Performance Measures
Cash ManagementProgram HistoryIn 1879, KSA 75-603 requires that the State Treasurer keep an accurate account of the receipts and disbursements of the State Treasury. KSA 75-604, enacted in 1923, entrusts the State Treasurer with the possession of all public moneys paid into the treasury and permits the Treasurer to deposit moneys in Kansas banks designated as state depositories. The State Moneys Law (KSA 75-4201, et seq.), enacted in 1967, regulates the designation of banks that receive state accounts, the pledging of securities by these banks, and the rate of interest to be paid on deposits of state moneys. KSA 75-4218 as amended by the 1985 Legislative Session requires that banks pledge securities, the market value of which is equal to 100% of all funds on deposit over the Federal Deposit Insurance corporation coverage.
Consequences of Not Funding this ProgramThe State of Kansas could not provide the necessary 'checks and balances' with the State's accounting system and bank transactions. Distributions would not be calculated. Cash balance and cash projection information would not be provided to the PMIB, Department of Administration, and the Division of the Budget. Funds would not be collected by entities or be distributed back to fund designated projects. Program GoalsA. To record in an accurate and timely manner all receipts and disbursements for the State of Kansas and to promote electronic methods of receiving a distributing State monies. B. To ensure the safety of deposits held in the name of the State. C. To accurately determine the amounts due to local governments under the provisions of the various statutes which regulate each program, and to distribute these amounts to the local governmental units at the statutorily mandated times. D. To provide funding for low-interest loans for qualified linked deposit program borrowers. Performance Measures
Education SavingsProgram HistoryThe Kansas Postsecondary Education Savings Program, (Learning Quest Education Savings Program), was created by the 1999 Kansas Legislature, as authorized by section 529 of the federal Internal Revenue Code of 1986, as amended. The purpose of the education savings program is to establish higher education savings accounts. The program permits individuals and organizations to contribute to education savings accounts to pay postsecondary education expenses for individuals they designate or for themselves. The 2009 Legislature created the KIDS Matching Grant program allowing for low-income families to have a portion of their contributions matched by state funds.
Consequences of Not Funding this ProgramNo state oversight of the program manager contract to include plan design, performance management, and marketing. Would lead to the end of the popular 529 Learning Quest Savings Program. Would lead to the inability to match KIDS program contributions. Lack of outreach to low- to moderate- income families to encourage saving for higher education. Would result in a lack of resources to continue the educational curriculum. Program GoalsA. Allow more children the chance to go to post-secondary school by providing an opportunity for individuals and organizations to save for post-secondary education tuition and expenses. B. To actively market and promote the Kansas Learning Quest Educations Savings Program in all areas of the State of Kansas. C. To reach Kansans with information on Learning Quest through educational meetings and outreach opportunities. D. Increase the amount of assets transferred to our plan from competitors relative to those transferred out. Performance Measures
Unclaimed PropertyProgram HistoryThe Disposition of Unclaimed Property Act (KSA 58-3934 et seq.), originally enacted in 1979 (KSA 58-3901 et seq.), designates the State Treasurer to administer functions established by the Act. In 1983, SB 213 amended KSA 58-3905 and 58-3914, broadening the definition of abandoned property as it applies to intangible interests in business associations and specifying procedures for delivery to the State Treasurer of such property. In 1989, SB 326 amended the Act to shorten the time it takes for property to be presumed abandoned from seven years to five years and raised the dollar amount that could be reported in the aggregate from $3 to $25. In 1994, SB 393 brought the Unclaimed Property program into compliance with the then most current uniform code for unclaimed property. In 1996, HB 2643 amended the Act to raise the aggregate dollar amount to $100, redefined when a financial institution must presume a demand account to be abandoned, and provided additional flexibility in the advertisement of owner names. In 1999, SB 17 amended the Act to relieve a holder of its requirement to file a report if it has no individual property over $100 and the total of its aggregated property is under $250.
Consequences of Not Funding this ProgramKansans would be deprived of their rightful property. Properties would not be remitted to the State and property owners would not be able to claim property. UP legislation provides each State with the authority to create a centralized place for persons to search for lost property and a process to claim the property. Program GoalsA. Ensure the accurate and timely reporting and remitting of various types of unclaimed property to the State Treasurer and the identification and return of property to its rightful owner(s) or heir(s). B. To approve or deny 100% of all claims for abandoned property delivered to the State Treasurer as quickly as possible after the filing of the claim and the receipt of the necessary information to make a legal determination and explore new strategies for identifying potential owners of unclaimed property. Performance Measures
HUMAN SERVICESHUMAN SERVICESCommission on Veterans AffairsAdministrationProgram HistoryThe agency was detached from Department of Human Resources and established as an independent state agency in 1986. In 2014, the previous Kansas Commission on Veterans Affairs was abolished and powers, duties and functions were transferred to the Kansas Commission on Veterans Affairs Office (KSA 73-1208d). There was no major change in agency operations, goals or programs. The major change came by establishing the agency within the executive branch of government, with direction and supervision coming from a Director appointed by the Governor and subject confirmation by the Kansas Senate (KSA 73-1208e). KSA 73-1209 lays the general framework for the agency.
Consequences of Not Funding this ProgramIf administration is not funded, the agency would not be able to maintain a Director, Chief Fiscal Officer or Director of Human Resources. Not funding these positions and other requisite expenditures, means the agency would not maintain central oversight of all other agency programs. Program GoalsA. Maintain statewide costs per case while maintaining quality service to clients. B. Provide fiscal, human resources, and IT services to other program areas. State Veteran Nursing HomesProgram HistoryIn 1889, Fort Dodge became the Kansas Soldiers Home and operated as its own state agency until 1976. In 1976, the Kansas Soldiers Home was operated by the Kansas Veterans' Commission under the Department of Human Resources. In 1986, the Kansas Veterans' Commission was abolished and the Kansas Commission on Veterans Affairs and the Commission, along with the Soldiers' Home, became its own independent agency with the Commission maintaining supervisory control of the Soldiers' Home. In 1997, the former Winfield State Hospital and Training Center was converted to the Kansas Veterans' Home under the supervisory control of the Kansas Commission on Veterans Affairs.
Consequences of Not Funding this ProgramWould not be able to provide long term healthcare services to eligible Kansas Veterans. Program GoalsA. Provide quality long term healthcare services to eligible Kansas Veterans through services provided by the Kansas Veterans' Home and Kansas Soldiers' Home. B. Kansas Veterans' Home and Kansas Soldiers Home will maintain fiscal integrity and good relations with other state agencies, vendors, and contractors. C. Maintain and encourage facilities' connections with the local community area media outlets, and local and national service organizations. Performance Measures
Veterans CemeteriesProgram HistoryOn April 22, 1999 KSA 73-1232 authorized the establishment and maintenance of a state system of Veterans' cemeteries.
Consequences of Not Funding this ProgramWould not be able to provide Veterans and their eligible family mnembers with internment opportunities. Program GoalsA. Provide Veterans and their eligible family members with interment opportunities for burial with dignity and honor in a Kansas Veterans' Cemetery. Performance Measures
Veterans ServicesProgram HistoryThe Service Agency was established in 1937 as a Division of Social Welfare to assist Veterans and survivors in obtaining federal benefits. The Approval Agency was established in 1945 to implement the G.I. Bill. On January 20, 1946, the responsibility of accrediting institutions and business establishments was transferred to the Office of Veterans' Affairs, as the State Approving Agency (SAA). On April 20, 1946, SB 396 created the Veterans' Claims Assistance Program (VCAP). KSA 73-1234 is the modern embodiment of the VCAP. KSA 74-8724 established the Veterans' Enhanced Service Delivery Program. In 2011, this program started receiving funds from lottery scratch ticket sales. In 2009, KSA 73-1238 established the Vietnam Era Veterans' Medallion Program, which provides for application from Veterans for a medal, medallion and certificate of appreciation for Kansas Vietnam Era Veterans.
Consequences of Not Funding this ProgramWould not be able to provide information and advocacy to Kansas Veterans and eligible families. Program GoalsA. Provide information and advocacy to Kansas Veterans and eligible family members by assisting them in obtaining all federal and state benefits they have earned. Performance Measures
Department for Aging & Disability ServicesBehavioral HealthProgram HistoryKDADS has served as the single state agency for behavioral health services for SAMHSA since the agency was formed during the reorganization of SRS. KDADS manages the federal block grant programs for mental health and substance abuse prevention and treatment. KDADS also manages state funding for behavioral health services and creates policy and procedures for implementing programs as well as providing oversight and quality assurance of state funded programs.
Consequences of Not Funding this ProgramWhen services are reduced or not available, there is an increased chance of homelessness, substance use, overdoses, suicide, and incarceration. Decreasing funding for behavioral health will shift burden of costs to local law enforcement, hospitals, and jails. It will also diminish the chances of full recovery and will mean a greater fiscal impact to the state. Program GoalsA. Address and treat people who are in immediate crisis. B. Increase availability of diagnosis and treatment of SMI/SUD. C. Stabilize patients so that they can return to the community. Behavioral Health: Client Assessment, Referral, and Evaluation (CARE)Performance Measures
Behavioral Health: Crisis CentersPerformance Measures
Behavioral Health: Mental Health TreatmentPerformance Measures
Behavioral Health: Problem GamblingPerformance Measures
Behavioral Health: Substance Use Disorder (SUD) TreatmentPerformance Measures
Capital ImprovementsProgram HistoryIn 1953, the Legislature approved SB 26 creating the an Institutional Building Fund to pay for repairing and equipping of buildings at the state institutions. The funds are collected from an annual state tax of one-half mill on all the property subject to Ad Valorem taxation under the general tax laws of Kansas. The 1990 Session, HB 2607, Sec. 24, established the Institutional Rehabilitation and Repair Fund. The purpose of the fund was to consolidate the central funds that were setup over the years into one fund titled Institutional Rehabilitation and Repair Fund. The fund is now called the State Institutions Building Fund for use at the state hospitals, Juvenile correctional facilities, and Veterans or Soldiers Homes.
Consequences of Not Funding this ProgramWithout funding for capital improvement projects at the state hospitals, buildings used to house patients and the infrastructure to support the staff and patient care will deteriorate over time. Providing routine rehabilitation and repair of facilities and infrastructure, as well as allowing for major remodeling of facilities to meet changing needs, is critical to maintaining certification and accreditation. Capital improvement funding also pays to redeem bonds issued to remodel and maintain buildings at the state hospitals. Not appropriating SIBF funds for debt service risks violating the terms of the bond. Program GoalsA. To provide state funding for capital projects identified and prioritized across the 4 state hospitals. Long Term Support and ServicesProgram HistoryThe Program provides financial support to the 11 area agencies on aging. Support is provided through both federal and state funds. The federal funds include monies awarded under the federal Older Americans Act. The funds finance inhume services for frail individuals, supportive services delivered at the senior centers, case management services, elderly abuse and disease prevention, and health promotion services. The LTSS Commission administers grant programs, including the Senior Care Act and Nutrition Grants, as well as the Client Assessment, Referral. and Evaluation Program. This program screens all nursing home applications and inquiries to determine whether institutionalization could be delayed or prevented through less expensive community services. Sate support is provided through the senior Care Act, which finances in-home services for the elderly so that they can remain in their homes. The Department also provides funding to community providers and the state's 11 area agencies on aging, so they can provide congregate and home-delivered meals to the elderly under the Congregate Meals Program at centralized meal sites. At these sites, the elderly can gather, socialize, and receive other services. The program is financed by federal funds that are matched with monies form the State General Fund, county mill levies, and local contributions. Home-delivered meals are provided through the federal Older Americans Act. The program targets individuals unable to reach the congregate meal sites. Both congregate and home delivered meal programs are eligible for grant support by the U.S. Department of Agriculture, which partially reimburses the programs on a per-meal basis.
Consequences of Not Funding this ProgramFailure to fund this program would result in the cessation of community based services to seniors who can contribute to the cost of their care through the Area Agencies on Aging and would force those seniors to spend down their financial resources quicker making them eligible for Medicaid sooner than they would have been otherwise. Further, both congregate meals and home-delivered meals would no longer be able to be provided, risking the nutrition and health of the seniors who rely on these services. Program GoalsA. Assist older Kansans who are at risk of institutionalization with services to help them remain in their homes. B. Provide quality meal services to older Kansans in order to improve or maintain their health and nutritional status. C. Implement person-centered, self-determined services that allow individuals to live successfully in their home and community. Long Term Support and Services: Aging and Disability Resource Centers (ADRC)Performance Measures
Long Term Support and Services: Customer ReviewsPerformance Measures
Long Term Support and Services: MIPPAPerformance Measures
Long Term Support and Services: OAA- Nutrition ProgramPerformance Measures
Long Term Support and Services: Older Americans Act (OAA)Performance Measures
Long Term Support and Services: SHIP (SHICK)Performance Measures
Long Term Support and Services: Senior Care Act (SCA)Performance Measures
MedicaidProgram HistoryIn 1981, Congress authorized Home and Community Based Service (HCBS) waiver under section 1915(c) amendment of the Social Security Act, created as a part of the Omnibus Budget Reconciliation Act of 1981. Section 1915(c) allowed states to provide home and community-based services for individuals who preferred to receive their services at home rather than in an institution.
Consequences of Not Funding this ProgramMedicaid Home- and Community-Based Services (HCBS) are types of person-centered supports and services that address the needs of people with functional limitations who need assistance with ADLs, IADLs, and rehabilitation specifically designed to enable people to stay in their homes, rather than moving to a facility for care. Not funding Medicaid Home-and Community-Based Services (HCBS) would result in thousands of Kansas becoming institutionalized in already over-burdened long term care facilities in the state. Inadequate funding will lead to increase in waiting list for services for Kansans with Intellectual and Developmental Disability; Physical Disability; and could complicate service-delivery for children with autism spectrum disorder, and persons with acquired or traumatic brain injury. Program GoalsA. To ensure that Kansas with high level of care (ADL and IADL) needs, and at imminent risk of institutionalization are served and supported while remaining in the homes and communities. B. To deliver equitable services and supports to Kansans with different forms of disabilities by encouraging competitive and integrated employment alternatives and opportunities, incentivizing positive movement towards greater independence through competitive employment, and creating a path for disability employment and empowerment in the state of Kansas. C. To divert psychiatric hospitalization by providing intensive Home and Community Based Support Services (HCBS) to children and youth in their homes and communities; provide short-term rehabilitation to individuals with brain injury; support parents of children with autism spectrum disorder; support children and youth chronically ill or medically fragile and dependent upon a ventilator or medical device to compensate for the loss of vital bodily function; and support frail and elderly Kansans above 65 years of age. D. Provide sub acute psychiatric services for SED youths in crisis. Medicaid: HCBS ManagementPerformance Measures
Medicaid: Psychiatric Rehabilitation Treatment Facilities (PRTF)Performance Measures
OperationsProgram HistoryThe Kansas Department for Aging and Disability Services was created by the 1977 Legislature as the Kansas Department on Aging. In FY 2013, the Governor implemented a reorganization of the state's social services agencies to include the transfer of mental health services, substance abuse disorder services, and Home and Community-Based Services Waivers from the Department of Social and Rehabilitation Services (SRS) to the newly named Kansas Department for Aging and Disability Services. It is a cabinet-level agency that administers federal and state programs to assist elderly citizens as well as individuals in need of disability, mental health, and addiction services.
Consequences of Not Funding this ProgramEssential executive functions and financial operations basic to the functioning of the agency would not be performed to effectively provide services to vulnerable Kansans. Essential functions include Legal, Human Resources, Fiscal, Public Affairs, and IT. Program GoalsA. Planning, policy development, administration, coordination, prioritization, and evaluation of all state activities related to older Kansans and Kansans with disabilities. B. Promote healthy aging with personal and financial independence and high quality service and supports at all levels of individuals needs. C. Analyze consumer focused quality data (timely and accurately) across all service settings to improve the service quality. State Hospital CommissionProgram HistoryThe State Hospital Commission was created on June 2, 2019 by the Secretary of the Kansas Department of Aging and Disability Services. The State Hospital Commission is responsible for providing leadership, guidance, direction, oversight, training and support to the five State Hospitals: Kansas Neurological Institute, Parsons State Hospital and Training Center, Larned State Hospital, Osawatomie State Hospital and Adair Acute Care on Osawatomie State Hospital's campus. The Commission provides day to day management and collaboration with Superintendents and executive staff at the State Hospitals, ensuring compliance with conditions of participation for certification with Centers for Medicaid and Medicare Services (CMS) and accreditation with the Joint Commission. Key programs administered by the Hospital commission include Medical liability insurance for physicians, Cost report preparation services, implementation and support of a pharmaceutical dispensing system, leading contract services and procurement for food service operations and contract nursing staff, project management related to implementing the state learning management system, and procuring a system wide electronic medical record system.
Consequences of Not Funding this ProgramThe State Hospital Commission provides general administrative support to the 4 state hospitals including joint purchasing efforts and risk management oversight. The SHC is leading efforts to implement a new Electronic Health Record system across the hospitals, overseeing implementation of regional hospital beds to serve adults in mental health crisis, and a pharmacy system. These significant efforts would not be successful without the coordinating role of the SHC commission team to liaison among KDADS, Department of Administration, and the individual state hospital staff. Program GoalsA. Ensure state hospital budget submissions are integrated into the KDADS budget priorities and goals. B. Standardize risk management reporting across the state hospitals to inform the Governing Body about patient safety and care practices. C. Lead projects to modernize processes and implement technology solutions to improve and enhance critical processes, patient safety and clinical outcomes. Survey, Certification, and Credentialing CommissionProgram HistoryThe Survey and Certification Division reviews for compliance nursing facilities and providers for state licensure and federal certification. These responsibilities are accomplished through the administrative review of initial qualifications and ongoing surveys conducted by teams of registered nurses or limited practical nurses that ensure ongoing compliance with state regulations and federal certification requirements. There are currently approximately 330 nursing facilities in Kansas that must be surveyed or inspected no less than every 15.9 months with a monthly average of 12 months. The Survey and Certification Division also enforces and implements the Complaint Program for healthcare facilities. The Enforcement Coordinator assures that corrective actions are imposed accurately and in a timely way when facilities fail to meet conditions of participation, licensure and certification standards. The Complaint Program performs complaint intake activities through the complaint hotline, triages complaints for severity, coordinates with other state agencies including the Department of Children and Families and the Department of Health and Environment that handle complaints for other types of facilities and assures that onsite investigations are coordinated for complaint intakes according to state and federal requirements. The State Licensed Adult Care Home Division approves assisted living, residential health care facilities, home plus, adult day care and boarding care homes for licensure under state law, regulation and rule. These responsibilities are accomplished through administrative review of initial qualifications and ongoing surveys conducted by registered nurse surveyors to ensure ongoing compliance with state regulations. There are approximately 350 free standing facilities and approximately 100 state licensed facilities attached to nursing facilities. The State of Kansas began requiring operators of adult care homes, home health agencies and staffing agencies to conduct criminal background checks of staff to ensure that no one worked in those settings who had a criminal history of a prescribed list of crimes. This legislation went into effect July 1, 1997, and the enforcement of "prohibited" criminal histories began in 1998. In a partnership between KDADS and the Kansas Bureau of Investigation (KBI), operators submit information on each person that is a candidate for employment to the HOC Criminal Record Check program. HOC is linked to the KBI through a telecommunications system which provides initial data on each person for whom there is a record check requested. The information from KBI is shared with the facility operators to determine a person's eligibility to work in that setting. HOC enters the data for these requests, processes the information received back from the KBI and notifies the operators when a criminal record indicates a person should not be employed. In 2016, legislation expanded the criminal record check requirements to include individuals employed in all facilities licensed by KDADS.
Consequences of Not Funding this ProgramFailure to fund these programs could result in no regulatory oversight of adult care homes in Kansas putting the elder residents they serve at risk for abuse, neglect and exploitation. Failure to fund backgrounds checks would impact the population previous mentioned as well as all of those individual who are receiving intellectual, developmental or behavioral health services in the home and community. Program GoalsA. Provide enforcement and oversight to ensure the requirements that Long-Term Care facilities must meet to participate in the Medicare and Medicaid program. B. Ensure compliance with statutory requirements for licensure of adult care homes and ongoing inspections/investigations of complaints related to allegations of Abuse Neglect and Exploitation. C. Ensure compliance with statutory requirements for Criminal Record Check program and Nurse Aide registry as well as several health occupations curriculum, course approval and licensure/certification of these occupations. Performance Measures
Survey, Certification, and Credentialing Commission: ACH State Licensed & SurveyPerformance Measures
Survey, Certification, and Credentialing Commission: Background ChecksPerformance Measures
Survey, Certification, and Credentialing Commission: Skilled Nursing Facility/NFPerformance Measures
Department for Children & FamiliesAdministration: Audit ServicesProgram HistoryAudit Services provides an independent appraisal, examination and evaluation function within DCF. It is responsible for providing all levels of agency management with independent and objective financial, compliance and performance audits, reviews, evaluations and consulting.
Consequences of Not Funding this ProgramDCF would lose resources to monitor and evaluate operations. Administration: Executive and Administrative ServicesProgram HistoryThis subprogram includes the Office of the Secretary and Administrative Services.
Consequences of Not Funding this ProgramEssential executive functions and financial operations would not be performed. Administration: Information Technology ServicesProgram HistoryInformation Technology Services (ITS) is responsible for managing agency-wide information technology systems, which includes: 1) reporting on required projects to the Kansas Information Technology Office, 2) aligning processes with internal customers, 3) providing strategic planning of information technology to ensure alignment with the agency business units, 4) developing and maintaining the core information systems that support the agency's business units and programs, 5) supporting business users by implementing and maintaining the core network infrastructure for the agency, and 6) providing security for all information technology resources.
Consequences of Not Funding this ProgramThe elimination of ITS would debilitate agency operations. All major agency programs rely on state-wide automated systems. Most of the agency's communication relies on electronic connectivity. Administration: Legal ServicesProgram HistoryThe Kansas Department for Children and Families (DCF) Legal Services provides legal counsel and representation to the Secretary and program areas. DCF Legal Services defends against litigation filed against the agency. The Fraud Investigations Unit is responsible for coordinating efforts to combat fraud in every program of the agency.
Consequences of Not Funding this ProgramDCF would lack legal representation and advice in a broad range of matters. Administration: Organizational Health and DevelopmentProgram HistoryOrganizational Health & Development (OHD) supports and strengthens the capacity of each DCF employee and the culture that supports them. The essential elements of safety, effectiveness and compliance are the starting point of OHD efforts. These trainings provide employees with a needed understanding of required policies, procedures and regulatory standards.
Consequences of Not Funding this ProgramThe capacity to provide staff development opportunities and training on critical topics would be eliminated. This, in turn, would reduce services and/or increase risks to our clients while potentially jeopardizing federal funding sources. Administration: Personnel ServicesProgram HistoryPersonnel Services provides traditional personnel support to all agency staff. The program places priority on quality employee service and enhancing recruitment, retention, and engagement of staff. Effective March 3, 2011, by Executive Order No. 11-04, the duties of Personnel Services transferred to the Kansas Department of Administration. Funding for this program remains with DCF.
Consequences of Not Funding this ProgramBasic personnel functions could not be performed. Administration: Reserve Pool and InsuranceProgram HistoryThis program was established to budget positions for which the agency lacks funding.
Capital ImprovementsProgram HistoryThe Capital Improvements program represents capital improvement costs of the Topeka Service Center. The Topeka Service Center is a building at 500 SW Van Buren in Topeka, KS, that serves as the DCF service center for the East Region. The Agency leases this building from the Kansas Department of Administration on a lease to buy agreement which was refinanced in FY2021. DCF is responsible for capital improvements to the Topeka Service Center.
Consequences of Not Funding this ProgramSafety risk for clients and DCF staff. Child Support Services: Child Support AdministrationProgram HistoryChild Support Services was established in 1975 under Title IV-D of the Social Security Act. Since its inception, the CSS IV-D program has evolved into a full-service family support program. The Child Support Services Program provides a variety of services including parent location; establishment of legal parentage; the establishment, enforcement and modification of child and medical support court orders; and the collection and distribution of child support payments. Although mandatory cooperation with the CSS Program is required for cash, food, and child care assistance, CSS services are available to anyone who enrolls for services. Kansas uses both judicial and administrative methods to enforce court orders.
Consequences of Not Funding this ProgramThe lack of financial support for a child's basic needs may force parents to seek public assistance. Children receive a long-term solution by the establishment of a court order for parentage and child and medical support, as well as enforcement of existing support orders through the CSS program. Program GoalsA. Improve the financial stability of children by establishing parentage and appropriately sized child and medical support orders for each family unit.Improve the financial stability of children by establishing parentage and appropriately sized child and medical support orders for each family unit. Performance Measures
Client Service Delivery: Child and Adult Protective Services Field StaffProgram HistoryThe Social Services Field subprogram provides services in the following areas: child protective services, prevention and assessment, foster care grant coordination, independent living, support services, adult protective services.
Consequences of Not Funding this ProgramChildren and adults would experience abuse and neglect. The Title IV-B State Plan would not be approved. Program GoalsA. Accurately assess the safety and needs of children and adults during abuse investigations. B. Perform accurate and timely service assessments and eligibility determinations. C. Provide case management and services appropriate to client needs. D. Provide services resulting in gainful employment and self-sufficiency. Performance Measures
Client Service Delivery: Economic and Employment Eligibility Field StaffProgram HistoryEconomic and Employment Services field staff review applications to ensure a person's eligibility to qualify for cash, child care, food, and energy assistance. Eligibility workers collect applicants' information via interviews and verify applicants' financial information. In addition, they help individuals by identifying their needs, answering questions about the programs, helping them fill out forms, and referring them to the appropriate services. They also convey program requirements, including referrals to work programs, and perform periodic eligibility redeterminations. The Quality Assurance Program included in this subprogram monitors the accuracy of eligibility and benefit determinations.
Consequences of Not Funding this ProgramPersons living in poverty may be unable to meet basic needs and care for their children. State plans would not be approved and federal funding would be jeopardized. Program GoalsA. Accurately assess the safety and needs of children and adults during abuse investigations. B. Perform accurate and timely service assessments and eligibility determinations. C. Provide case management and services appropriate to client needs. D. Provide services resulting in gainful employment and self-sufficiency. Performance Measures
Client Service Delivery: Pre-Employment Transition Services Field StaffProgram HistoryPre-Employment Transition Services (Pre-ETS) specialists help young people with disabilities transition to self-sufficiency by providing an early start at job exploration, career planning, and post-secondary counseling. The objective of the specialists is to enhance the youths' capacity to gain competitive integrated work directly after high school, or after graduation from college or technical training.
Consequences of Not Funding this ProgramLoss of early attachment to employment, resulting in greater lifelong reliance on public benefits. Reduced employment among Kansas youth with disabilities. Program GoalsA. Accurately assess the safety and needs of children and adults during abuse investigations. B. Perform accurate and timely service assessments and eligibility determinations. C. Provide case management and services appropriate to client needs. D. Provide services resulting in gainful employment and self-sufficiency. Performance Measures
Client Service Delivery: Region AdministrationProgram HistoryRegional administration programs provide a broad range of operational support that allows the delivery of human services in the regions to run efficiently. The administrative services support program areas through the following functions: fiscal, human resources, legal, fraud investigations, information technology support, and facilities.
Consequences of Not Funding this ProgramClient service delivery would not be viable without local direction and administrative support. Program GoalsA. Accurately assess the safety and needs of children and adults during abuse investigations. B. Perform accurate and timely service assessments and eligibility determinations. C. Provide case management and services appropriate to client needs. D. Provide services resulting in gainful employment and self-sufficiency. Client Service Delivery: TANF Employment Services Field StaffProgram HistoryTANF Employment Services case managers conduct assessments to develop individualized plans that identify the services that best support a client's self-sufficiency goals and which reinforce the client's strengths, needs, and abilities. Clients are provided information on work opportunities, resources, and program requirements to support them in making decisions on case-plan activities. Case managers monitor each client's compliance with their case plan and progress toward self-sufficiency.
Consequences of Not Funding this ProgramJob skills, training, and employment case management would not be available for TANF recipients. The agency would incur a penalty for failing to meet the TANF work participation requirements. Program GoalsA. Accurately assess the safety and needs of children and adults during abuse investigations. B. Perform accurate and timely service assessments and eligibility determinations. C. Provide case management and services appropriate to client needs. D. Provide services resulting in gainful employment and self-sufficiency. Performance Measures
Client Service Delivery: Vocational Rehabilitation Field StaffProgram HistoryVocational Rehabilitation (VR) field staff provide services for Kansans with disabilities which assist them to obtain or maintain employment in the competitive and integrated workplace. VR counselors interview individuals to assess their work skills and capacities. They work with clients to plan services leading to employment. Services include vocational training, assistive technology, job coaching, job tryouts, restoration services, and job placement. After a client secures employment, counselors continue to provide guidance for at least 90 days to ensure stability on the job, as well as client and employer satisfaction.
Consequences of Not Funding this ProgramFewer people with disabilities would become gainfully employed and self-reliant. Rehabilitation Services state plan would not be approved. Program GoalsA. Accurately assess the safety and needs of children and adults during abuse investigations. B. Perform accurate and timely service assessments and eligibility determinations. C. Provide case management and services appropriate to client needs. D. Provide services resulting in gainful employment and self-sufficiency. Performance Measures
Developmental Disability CouncilProgram HistoryThe Kansas Council on Developmental Disabilities (KCDD) is composed of members appointed by the Governor and represents the developmental disability community. The council advocates for improvements in the Kansas system with the goal of providing people with intellectual and developmental disabilities, family members, and caregivers the services and support they need.
Consequences of Not Funding this ProgramAdvocacy for persons with developmental disabilities would be diminished. This reduction in advocacy efforts would make it less likely that individuals could achieve their potential abilities and goals. Performance Measures
Disaster ReliefProgram HistoryProvided staffing for COVID emergency shelters.
Consequences of Not Funding this ProgramCOVID emergency shelters would not have been staffed. Economic and Employment Services: Child Care AssistanceProgram HistoryChild Care Assistance provides low-income, working families with access to affordable, quality child care that allows them to continue working, attend training, or continue their education. It is also provided to families whose children are receiving protective services. Child care benefits vary depending on the family's income, the number of children in care, hours of care, the age of the child, and the type and location of child care setting. The first major federal child care program originated in 1990. Beginning in FY 2021, the method of paying for child care was changed from authorizing funds for a specific number of hours based on the parent's work schedule to authorizing child care in part-time or full-time blocks.
Consequences of Not Funding this ProgramA penalty would be incurred for failing to meet a TANF provision requiring child care to be provided to the children of TANF recipients in work activities. In addition, low-income, employed parents who rely on child care would either be unable to continue working or would be compelled to leave their children in unsafe care arrangements. Program GoalsA. Assist low-income families and individuals in obtaining training and education to encourage personal responsibility. B. Provide appropriate support services to assist clients in gaining or retaining employment and becoming self-sufficient. Performance Measures
Economic and Employment Services: Child Care QualityProgram HistoryThe Child Care Quality Program provides information to parents about child care available in their communities and referrals to other programs in response to family needs. This is accomplished by maintaining a database on child care programs, building the supply and quality of child care by providing training and technical assistance to new and existing providers, and providing technical assistance.
Consequences of Not Funding this ProgramDCF would incur a penalty for failing to meet the Child Care and Development Fund spending targets for child care quality and infants and toddlers. Parents would be less informed on child care resources. The qualifications of the child care workforce would decline. Program GoalsA. Assist low-income families and individuals in obtaining training and education to encourage personal responsibility. B. Provide appropriate support services to assist clients in gaining or retaining employment and becoming self-sufficient. Performance Measures
Economic and Employment Services: Child Care StabilizationProgram HistoryChild Care Stabilization Grants were appropriated in the American Rescue Plan (ARP) Act during the COVID pandemic. These purpose of the grants was to support the stability of the child care sector during and after the public health emergency. At least 90% of the funds were spent as subgrants to qualified child care providers. Providers may spend their funds on a variety of operating expenses including wages and benefits, rent and utilities, cleaning and sanitation supplies, and services and other goods and services necessary to maintain or resume child care services.
Consequences of Not Funding this ProgramParents may not be able to maintain employment due to lack of available child care. Program GoalsA. Assist low-income families and individuals in obtaining training and education to encourage personal responsibility. B. Provide appropriate support services to assist clients in gaining or retaining employment and becoming self-sufficient. Performance Measures
Economic and Employment Services: EES AdministrationProgram HistoryThe EES Administration Program develops policies and implements federal requirements for several assistance programs including cash assistance, employment services, food assistance, utility assistance, and child care. The policies issued by EES Administration are executed by staff in the department's six regions. This subprogram also manages grants and contracts that address case management for at-risk families, child care quality initiatives, domestic violence services, and nutrition education, among others.
Consequences of Not Funding this ProgramThe absence of management would impair the execution of agency initiatives and policies, as well as the operation of federal programs. Economic and Employment Services: Electronic Benefits Transfer (EBT) and Eligibility DeterminationProgram HistoryEBT: TANF, SNAP, and child care assistance are delivered by electronic benefit transfers. Federal law requires SNAP benefits to be issued via EBT. DCF has contracted with a financial services company to provide electronic benefits processing since FY 1997.
Consequences of Not Funding this ProgramThe SNAP state plan would not be approved, as USDA mandates EBT. The fraudulent use of benefits would increase. Benefit accuracy would decline. Program GoalsA. Assist low-income families and individuals in obtaining training and education to encourage personal responsibility. B. Provide appropriate support services to assist clients in gaining or retaining employment and becoming self-sufficient. Performance Measures
Economic and Employment Services: Food DistributionProgram HistoryThe Food Distribution program distributes food to low income households. Food products shipped to Kansas by the U.S. Department of Agriculture (USDA) are warehoused and shipped to local sites by a contractor. The food is delivered to central sites with the assistance of a network of local non-profits. The value of food commodities is not included in the budget.
Consequences of Not Funding this ProgramFewer low-income persons would have safe, nutritious, and balanced meals. Program GoalsA. Assist low-income families and individuals in obtaining training and education to encourage personal responsibility. B. Provide appropriate support services to assist clients in gaining or retaining employment and becoming self-sufficient. Performance Measures
Economic and Employment Services: Head Start CollaborationProgram HistoryThe purpose of the Head Start Collaboration grant is to assist in building early childhood systems, provide low-income children access to comprehensive services, and increase collaboration between the Federal Head Start program and State services. The collaboration grant was first received in FY 2004.
Consequences of Not Funding this ProgramCollaboration activities would be transferred to a non-state entity. Program GoalsA. Assist low-income families and individuals in obtaining training and education to encourage personal responsibility. B. Provide appropriate support services to assist clients in gaining or retaining employment and becoming self-sufficient. Performance Measures
Economic and Employment Services: Kansas Early Head StartProgram HistoryKansas Early Head Start serves low-income pregnant women and families with infants and toddlers, and children with disabilities. The program is a comprehensive program designed to meet the individual needs of each child and family. Program services include quality early education, parent education and other family support services. The program has two models: Home Visitation (TANF funded) and Child Care Partnership (CCDF funded).
Consequences of Not Funding this ProgramFewer children would be adequately prepared to enter school, resulting in negative long-term consequences. Program GoalsA. Assist low-income families and individuals in obtaining training and education to encourage personal responsibility. B. Provide appropriate support services to assist clients in gaining or retaining employment and becoming self-sufficient. Performance Measures
Economic and Employment Services: SNAP BenefitsPerformance Measures
Economic and Employment Services: SNAP Employment and TrainingProgram HistorySNAP Employment & Training (SNAP E&T): Promotes employment and self-sufficiency by providing job search, education and training related to employment, and job retention services to SNAP recipients who do not receive TANF. Able-Bodied Adults without Dependents (ABAWDS) between the ages of 18 and 49 who not working at least 30 hours per week must be assigned to employment and training services.
Consequences of Not Funding this ProgramJob readiness services would not be available for SNAP recipients. The State would not obtain state plan approval for the SNAP Program. Program GoalsA. Assist low-income families and individuals in obtaining training and education to encourage personal responsibility. B. Provide appropriate support services to assist clients in gaining or retaining employment and becoming self-sufficient. Performance Measures
Economic and Employment Services: TANF Cash AssistanceProgram HistoryThe Temporary Assistance for Needy Families Cash Assistance program provides monthly benefits to low-income families for basic needs such as clothing, housing, utilities and transportation. The Personal Responsibility and Work Opportunity Act of 1996 removed the entitlement to welfare, established time limits and work requirements for welfare recipients, and instituted block grants to states. The lifetime limit for assistance is 24 months, with 12 additional months of assistance if the family meets hardship criteria. Almost all families with an adult must participate in work activities and seek employment through the TANF Employment Services program. Work participants must be engaged in one of eight employment activities for generally 30 hours per week.
Consequences of Not Funding this ProgramLow income parents may be unable to meet basic needs and care for their children. Program GoalsA. Assist low-income families and individuals in obtaining training and education to encourage personal responsibility. B. Provide appropriate support services to assist clients in gaining or retaining employment and becoming self-sufficient. Performance Measures
Economic and Employment Services: TANF Employment ServicesProgram HistoryThe TANF Employment Services program promotes employment and self-sufficiency by providing job search, education and training related to employment, and job retention services to TANF recipients. The program recognizes that some recipients or family members have barriers that must be addressed before they can succeed in the workplace. Employment services are tailored to meet individual and family needs and are coordinated through intensive case management. Adults receiving cash assistance receive help with child care, alcohol or drug abuse, domestic violence and other factors that affect family stability. They must participate in work activities to remain eligible for cash assistance. Twelve months of transitional services, including periodic job retention payments, are available to families leaving cash assistance due to employment
Consequences of Not Funding this ProgramJob skills and training would be unavailable to TANF cash assistance recipients. The state may incur a penalty for failing to meet the TANF work participation requirements. Program GoalsA. Assist low-income families and individuals in obtaining training and education to encourage personal responsibility. B. Provide appropriate support services to assist clients in gaining or retaining employment and becoming self-sufficient. Performance Measures
Economic and Employment Services: TANF Targeted GrantsProgram HistoryThe purpose of the Two-Parent Family Initiatives Program is to provide programming and services to at-risk youth and families across Kansas. Programming includes personal and professional development, education, and training designed to enhance family development. Domestic Violence Services provide adults who have been victimized by domestic violence and/or sexual abuse with safety planning, mentoring services, healthy relationship training, conflict resolution training, and financial literacy training. TANF Youth Services provide grant funding for a range of services to reduce poverty by providing primary prevention and early intervention services to reduce the likelihood at-risk youth will engage in high-risk behaviors and to help families achieve and maintain stability. Program services include assisting families so that children can be cared for in their own home, reducing dependency by promoting job preparation and economically beneficial employment, prevention of unplanned pregnancies, and encouraging the sustainability of healthy family relationships. The home visitation program promotes child well-being and maintenance of families.
Consequences of Not Funding this ProgramTerminating Domestic Violence Services means parents and relative caregivers who use controlled substances would remain in the home with their children potentially putting children at risk. Adults needing domestic violence services would be required to seek local assistance. Terminating these targeted grants would result in less favorable outcomes among the participating youths. Children would be less prepared for school. Performance Measures
Economic and Employment Services: Utility AssistanceProgram HistoryThe Low-Income Energy Assistance Program (LIEAP) provides an annual benefit to low income households for home energy bills. To qualify for benefits, families must be at or below 150 percent of the Federal Poverty Level (FPL). Benefits are based on income, household size, and the type and cost of fuel. Funding for weatherization is transferred to the Kansas Housing Resources Corporation. The federal funding for this program occurs as a block grant. The federal Low-Income Home Energy Assistance Program originated in 1980, in response to rising energy prices and Arab oil embargoes in the 1970s. In response to the COVID pandemic, the federally funded Low-Income Water Assistance Program (LIWAP) was established.
Consequences of Not Funding this ProgramA household's utilities could be disconnected. Program GoalsA. Assist low-income families and individuals in obtaining training and education to encourage personal responsibility. B. Provide appropriate support services to assist clients in gaining or retaining employment and becoming self-sufficient. Performance Measures
Prevention and Protection Services: Adoption ServicesProgram HistoryThis program is comprised of the adoption facilitation contract and expenditures required to fulfill Adoption Support maintenance of effort requirements related to the Fostering Connections Act. This Act allowed qualified state-funded adoption support clients to be converted to Title IV-E eligible status, resulting in state fund savings, and established a state maintenance of effort requirement. The state-fund savings must be spent on new Title IV-E or Title IV-B activities including post adoption services.
Consequences of Not Funding this ProgramGreatly extend the stay of approximately one-third of children in foster care whose appropriate permanency goal is adoption. In addition, the State would fail to gain approval for the Title IV-E and TANF Block Grant state plans. Program GoalsA. Provide temporary placements for children who cannot remain safely in their homes. B. Secure permanency for children in care by reuniting them with their families or finding permanent families for children who cannot safely return home. C. Assist youth leaving foster care without permanent families to live independently and become self-reliant. D. Provide assessments and interventions directed towards safeguarding the well-being and general welfare of children and vulnerable adults who are in need of protection. E. Provide prevention services to families based on each family's individual needs, eligibility and available resources. Performance Measures
Prevention and Protection Services: Adoption SupportProgram HistoryAdoption Support is designed to remove barriers to the adoption of children with special needs who otherwise could not be adopted, and to assist the adoptive family in meeting the special and ordinary needs of a child. The types of assistance the child receives are determined by negotiation with the Prevention and Protection Services staff. Assistance may include a special one-time payment, non-recurring expenses to provide for legal fees, an ongoing monthly financial subsidy, a medical card or a combination of these items.
Consequences of Not Funding this ProgramGreatly extend the stay of approximately one-third of children in foster care whose appropriate permanency goal is adoption. In addition, the State would fail to gain approval for the Title IV-E and TANF Block Grant state plans. Program GoalsA. Provide temporary placements for children who cannot remain safely in their homes. B. Secure permanency for children in care by reuniting them with their families or finding permanent families for children who cannot safely return home. C. Assist youth leaving foster care without permanent families to live independently and become self-reliant. D. Provide assessments and interventions directed towards safeguarding the well-being and general welfare of children and vulnerable adults who are in need of protection. E. Provide prevention services to families based on each family's individual needs, eligibility and available resources. Performance Measures
Prevention and Protection Services: Adult Protective ServicesProgram HistoryAdult Protective Services (APS) provides interventions for safeguarding the well-being and general welfare of adults who are unable to protect themselves. The intent of APS is to protect vulnerable adults from abuse, neglect, and financial exploitation while safeguarding their civil liberties. APS protection specialists investigate reports and provide protective services to adults aged 18 and older residing in the community and to adults residing in facilities licensed/certified by the Kansas Department for Aging and Disabilities.
Consequences of Not Funding this ProgramVictims would experience continued abuse and exploitation. Program GoalsA. Provide temporary placements for children who cannot remain safely in their homes. B. Secure permanency for children in care by reuniting them with their families or finding permanent families for children who cannot safely return home. C. Assist youth leaving foster care without permanent families to live independently and become self-reliant. D. Provide assessments and interventions directed towards safeguarding the well-being and general welfare of children and vulnerable adults who are in need of protection. E. Provide prevention services to families based on each family's individual needs, eligibility and available resources. Performance Measures
Prevention and Protection Services: Child Protective Services GrantsProgram HistoryThis subprogram is comprised of the following federal grants: Child Abuse Prevention and Treatment Act Grant, Children's Justice Act Grant, and the Adoption Incentive Grant. The grants provide training for abuse and neglect investigations, training grants for child advocacy centers, and prevention initiatives.
Consequences of Not Funding this ProgramChild protective service training would be limited or unavailable. Promising strategies on combating child abuse would not be deployed. Available federal funding sources would not be used to support and enhance child welfare related efforts. Program GoalsA. Provide temporary placements for children who cannot remain safely in their homes. B. Secure permanency for children in care by reuniting them with their families or finding permanent families for children who cannot safely return home. C. Assist youth leaving foster care without permanent families to live independently and become self-reliant. D. Provide assessments and interventions directed towards safeguarding the well-being and general welfare of children and vulnerable adults who are in need of protection. E. Provide prevention services to families based on each family's individual needs, eligibility and available resources. Performance Measures
Prevention and Protection Services: Families First ProgramProgram HistoryThe Families First Program provides prevention services to keep children and youth from entering out-of-home placement through approved evidence-based or emerging programs in mental health, substance use, parent skill building, and kinship navigation. This program has been developed based on the requirements of the federal Family First Prevention Services Act which allow states to access Title IV-E Foster Care funds for prevention services. Grants have been awarded to twelve community partners and stakeholders.
Consequences of Not Funding this ProgramA significant opportunity to expand child welfare prevention services and reduce the number of children in foster care would be lost. Program GoalsA. Provide temporary placements for children who cannot remain safely in their homes. B. Secure permanency for children in care by reuniting them with their families or finding permanent families for children who cannot safely return home. C. Assist youth leaving foster care without permanent families to live independently and become self-reliant. D. Provide assessments and interventions directed towards safeguarding the well-being and general welfare of children and vulnerable adults who are in need of protection. E. Provide prevention services to families based on each family's individual needs, eligibility and available resources. Performance Measures
Prevention and Protection Services: Family Crisis Support ServicesProgram HistoryThe Family Crisis Support Services program serves families and caregivers whose children are experiencing an increase in behavioral health symptoms. This program aspires to a continuum of care that deescalates and ameliorates a crisis before more restrictive or institutional intervention becomes necessary. The agency contracts for the management of a centralized behavioral health crisis hotline, screening, and mobile response stabilization services.
Consequences of Not Funding this ProgramFamilies would not receive supports or their children would be placed in restrictive or institutional interventions to receive needed supports. Program GoalsA. Provide temporary placements for children who cannot remain safely in their homes. B. Secure permanency for children in care by reuniting them with their families or finding permanent families for children who cannot safely return home. C. Assist youth leaving foster care without permanent families to live independently and become self-reliant. D. Provide assessments and interventions directed towards safeguarding the well-being and general welfare of children and vulnerable adults who are in need of protection. E. Provide prevention services to families based on each family's individual needs, eligibility and available resources. Performance Measures
Prevention and Protection Services: Family Preservation ServicesProgram HistoryFamily preservation grants are intensive, in-home, case management services offered to families who are at imminent risk of having a child removed from their home and placed in DCF custody. The services are family-centered, supportive, culturally competent and address the entire family as well as individual members. The program is designed as a two-tiered system, with the duration of the intensive services dependent on the tier to which the family is referred.
Consequences of Not Funding this ProgramChildren would experience continued abuse and neglect. More children would enter foster care. Program GoalsA. Provide temporary placements for children who cannot remain safely in their homes. B. Secure permanency for children in care by reuniting them with their families or finding permanent families for children who cannot safely return home. C. Assist youth leaving foster care without permanent families to live independently and become self-reliant. D. Provide assessments and interventions directed towards safeguarding the well-being and general welfare of children and vulnerable adults who are in need of protection. E. Provide prevention services to families based on each family's individual needs, eligibility and available resources. Performance Measures
Prevention and Protection Services: Family ServicesProgram HistoryThe purpose of the Family Services Program is to maintain children safely in their own homes by mitigating the risk factors that signal the likelihood of out-of-home placement. Services are provided to families in crisis resulting from a sudden onset of urgent circumstances which may endanger a child or children resulting in the risk of removal from their home. The services provided are based on a protection specialist's assessment of risk and safety at the time a report is received. Services are provided directly by DCF staff and/or other community agencies and organizations.
Consequences of Not Funding this ProgramChildren would experience continued abuse and neglect. More children would enter foster care. Program GoalsA. Provide temporary placements for children who cannot remain safely in their homes. B. Secure permanency for children in care by reuniting them with their families or finding permanent families for children who cannot safely return home. C. Assist youth leaving foster care without permanent families to live independently and become self-reliant. D. Provide assessments and interventions directed towards safeguarding the well-being and general welfare of children and vulnerable adults who are in need of protection. E. Provide prevention services to families based on each family's individual needs, eligibility and available resources. Performance Measures
Prevention and Protection Services: Foster Care Federal Disability AdvocacyProgram HistoryThe Foster Care Federal Disability Advocacy contract provides statewide disability determination, intensive case management, and legal representation for children with disabilities in foster care. The contractor screens referrals to determine if the child meets the Social Security Administration's standard of disability. The contractor is responsible for pursuing each case through the Social Security Administration application and appeals process to either a successful or non-successful claim. The funding is 100 percent State General Funds.
Consequences of Not Funding this ProgramApproximately $8.2 million in federal disability reimbursements would have to be replaced by state funds. Program GoalsA. Provide temporary placements for children who cannot remain safely in their homes. B. Secure permanency for children in care by reuniting them with their families or finding permanent families for children who cannot safely return home. C. Assist youth leaving foster care without permanent families to live independently and become self-reliant. D. Provide assessments and interventions directed towards safeguarding the well-being and general welfare of children and vulnerable adults who are in need of protection. E. Provide prevention services to families based on each family's individual needs, eligibility and available resources. Performance Measures
Prevention and Protection Services: Foster Care Grants for Children Receiving Out-of-Home ServicesProgram HistoryFoster care services are provided to children and families when the court has found the child to be in need of care, and the parents are not able to meet the safety and care needs of the child. Most children who require foster care have been abused or neglected and have significant developmental, physical and emotional needs, which require an array of services and care options. However, some children who are not abused or neglected may be placed in foster care for reasons such as out-of-control behavior, overwhelmed parents and running away from home. Four child welfare case management providers are responsible for providing services to the child and family including case planning, placement, service delivery, reporting to the court, and collaboration with community resources to ensure appropriate services are available in close proximity to the child's home.
Consequences of Not Funding this ProgramIt is assumed that children who were abused or neglected would be cared for by local governments or non-profit agencies. In addition, the State would fail to gain approval for the Title IV-E and TANF Block Grant state plans. Program GoalsA. Provide temporary placements for children who cannot remain safely in their homes. B. Secure permanency for children in care by reuniting them with their families or finding permanent families for children who cannot safely return home. C. Assist youth leaving foster care without permanent families to live independently and become self-reliant. D. Provide assessments and interventions directed towards safeguarding the well-being and general welfare of children and vulnerable adults who are in need of protection. E. Provide prevention services to families based on each family's individual needs, eligibility and available resources. Performance Measures
Prevention and Protection Services: Human TraffickingProgram HistoryThe purpose of the Human Trafficking program is to provide a safe placement for alleged victims of human trafficking in Kansas and refer them to the appropriate services. In previous years, assessments for alleged victims of human trafficking were paid from this subprogram; however, in FY 2021 that portion was incorporated into the foster care case management provider grants. Funding continues to pay for placement costs. Additionally, the budget includes $300,000 SGF appropriated by the 2021 Legislature to specifically fund services provided by Hope Ranch in Wichita.
Consequences of Not Funding this ProgramA safe placement solely for victims of human trafficking would be unavailable. Fewer victims would be reunited with their families. Program GoalsA. Provide temporary placements for children who cannot remain safely in their homes. B. Secure permanency for children in care by reuniting them with their families or finding permanent families for children who cannot safely return home. C. Assist youth leaving foster care without permanent families to live independently and become self-reliant. D. Provide assessments and interventions directed towards safeguarding the well-being and general welfare of children and vulnerable adults who are in need of protection. E. Provide prevention services to families based on each family's individual needs, eligibility and available resources. Performance Measures
Prevention and Protection Services: Independent LivingProgram HistoryExcept for youth in detention and locked facilities, Independent Living (IL) services are available to young people between the ages of 14 and 21, who were in custody of the Kansas Department for Children and Families (DCF) Secretary and in out-of-home placement for any length of time on or after their 14th birthday. The purpose of the program is to ensure that youth have a smooth and successful transition from foster care to independence. Available services include assistance with completing secondary and post-secondary education, monthly IL subsidies, life-skills training and leadership opportunities.
Consequences of Not Funding this ProgramEliminate a significant transitional support to children formerly in foster care who are pursuing independence and their life goals. Program GoalsA. Provide temporary placements for children who cannot remain safely in their homes. B. Secure permanency for children in care by reuniting them with their families or finding permanent families for children who cannot safely return home. C. Assist youth leaving foster care without permanent families to live independently and become self-reliant. D. Provide assessments and interventions directed towards safeguarding the well-being and general welfare of children and vulnerable adults who are in need of protection. E. Provide prevention services to families based on each family's individual needs, eligibility and available resources. Performance Measures
Prevention and Protection Services: Licensing Foster Care HomesProgram HistoryFoster Care Licensing is responsible for licensure and regulatory compliance for all 24-hour-per-day, seven-day-per-week childcare facilities, and for agencies that provide placement services in Kansas. They conduct initial and ongoing compliance inspection.
Consequences of Not Funding this ProgramThe health and safety in child care facilities would decline. Program GoalsA. Provide temporary placements for children who cannot remain safely in their homes. B. Secure permanency for children in care by reuniting them with their families or finding permanent families for children who cannot safely return home. C. Assist youth leaving foster care without permanent families to live independently and become self-reliant. D. Provide assessments and interventions directed towards safeguarding the well-being and general welfare of children and vulnerable adults who are in need of protection. E. Provide prevention services to families based on each family's individual needs, eligibility and available resources. Performance Measures
Prevention and Protection Services: Permanent CustodianshipProgram HistoryPermanent Custodianship is an option that is explored when there are compelling reasons for reintegration and adoption not being the preferred permanency option. This option may be more appropriate for older children, those with strong family bonds, or when cultural traditions influence the permanency decision. When custodianship is established, a subsidy may be provided to assist families willing to assume the responsibility of establishing a permanent home for older children and their siblings.
Consequences of Not Funding this ProgramSome children would remain in foster care. Program GoalsA. Provide temporary placements for children who cannot remain safely in their homes. B. Secure permanency for children in care by reuniting them with their families or finding permanent families for children who cannot safely return home. C. Assist youth leaving foster care without permanent families to live independently and become self-reliant. D. Provide assessments and interventions directed towards safeguarding the well-being and general welfare of children and vulnerable adults who are in need of protection. E. Provide prevention services to families based on each family's individual needs, eligibility and available resources. Performance Measures
Prevention and Protection Services: Prevention and Protection Services - Other GrantsProgram HistoryThis subprogram includes the following five specialized services: behavioral intervention, therapeutic family foster home capacity building and supports, family functional therapy for children in care, evidence based services for intellectual and developmental disabilities youth, and family resource center establishment.
Consequences of Not Funding this ProgramFamilies would not receive valuable services which could result in children being removed from the home. Program GoalsA. Provide temporary placements for children who cannot remain safely in their homes. B. Secure permanency for children in care by reuniting them with their families or finding permanent families for children who cannot safely return home. C. Assist youth leaving foster care without permanent families to live independently and become self-reliant. D. Provide assessments and interventions directed towards safeguarding the well-being and general welfare of children and vulnerable adults who are in need of protection. E. Provide prevention services to families based on each family's individual needs, eligibility and available resources. Performance Measures
Prevention and Protection Services: Prevention and Protection Services AdministrationProgram HistoryThe Prevention and Protection Services Administration Program (PPS) establishes policy and provides direction, oversight, and support to regional offices for several programs including child abuse investigations, prevention, reintegration/foster care, adoption services, independent living transitional services, and foster home and residential licensing.
Consequences of Not Funding this ProgramThe absence of management would impair the execution of agency initiatives and policies, as well as the operation of federal programs. Program GoalsA. Provide temporary placements for children who cannot remain safely in their homes. B. Secure permanency for children in care by reuniting them with their families or finding permanent families for children who cannot safely return home. C. Assist youth leaving foster care without permanent families to live independently and become self-sufficient. D. Provide assessments and interventions directed towards safeguarding the well-being and general welfare of children and vulnerable adults who are in need of protection. E. Provide prevention services to families based on each family's individual needs, eligibility and available resources. Prevention and Protection Services: Protection Report CenterProgram HistoryThe Kansas Protection Report Center (KPRC) receives statewide reports of child abuse/neglect and adult abuse/neglect or exploitative situations via a toll-free number, online submission, or fax. The three centers are located in Wichita, Kansas City and Topeka. Supervision of all locations is done by PPS Administration, allowing for more consistent operation and oversight. The Topeka location receives reports 24-hours-per-day/seven days per week, including holidays. The Wichita location receives reports from 6:00 a.m. to 7:00 p.m., seven days per week. The Kansas City location receives reports from 7:00 a.m. to 7:00 p.m., seven days per week.
Consequences of Not Funding this ProgramVictims would experience continued abuse. Calls would be rechanneled to law enforcement. Program GoalsA. Provide temporary placements for children who cannot remain safely in their homes. B. Secure permanency for children in care by reuniting them with their families or finding permanent families for children who cannot safely return home. C. Assist youth leaving foster care without permanent families to live independently and become self-reliant. D. Provide assessments and interventions directed towards safeguarding the well-being and general welfare of children and vulnerable adults who are in need of protection. E. Provide prevention services to families based on each family's individual needs, eligibility and available resources. Performance Measures
Prevention and Protection Services: Soul PermanencyPerformance Measures
Prevention and Protection Services: Tribal GrantsProgram HistoryChild Welfare Grants to Native American Tribes provide funding to the tribes in Kansas. It is the purpose and intent of the Indian Child Welfare Act of 1978 to protect the best interests of Native American children by preserving tribal integrity and reducing the removal of children from homes and tribal environments. The grants are to be used for prevention and foster care services.
Consequences of Not Funding this ProgramDCF would assume responsibility for children in need of care. Program GoalsA. Provide temporary placements for children who cannot remain safely in their homes. B. Secure permanency for children in care by reuniting them with their families or finding permanent families for children who cannot safely return home. C. Assist youth leaving foster care without permanent families to live independently and become self-reliant. D. Provide assessments and interventions directed towards safeguarding the well-being and general welfare of children and vulnerable adults who are in need of protection. E. Provide prevention services to families based on each family's individual needs, eligibility and available resources. Performance Measures
Rehabilitation Services: Deaf and Hard of Hearing ServicesProgram HistoryThe Kansas Commission for the Deaf and Hard of Hearing (KCDHH) develops and implements a program of information and referral, advocacy, public education and sign language interpreter registration. It also works with other organizations throughout Kansas to ensure the coordination and availability of services for people who are deaf and hard of hearing. A key function of the commission is the registry of sign language interpreters and ensuring those interpreters meet or exceed minimum skill levels and certification.
Consequences of Not Funding this ProgramLoss of advocacy role; no registry to verify qualifications of interpreters, failure to comply with Language Assessment Program requirements. Program GoalsA. Assist individuals with disabilities to gain or regain their independence through employment. B. Provide independent living services to facilitate community inclusion and integration for Kansans with disabilities. C. Perform timely and accurate disability decisions. D. Assure access to qualified sign language interpreters. E. Prepare youth with disabilities to achieve employment and self-sufficiency as adults. Performance Measures
Rehabilitation Services: Disability Determination ServicesProgram HistoryDisability Determination Services performs medical disability determinations for the U.S. Social Security Administration on most Social Security Disability Insurance and Supplemental Security Income claims filed or reviewed in Kansas. The program's inception dates to 1937, when the Kansas Board of Social Welfare was authorized to enter into an agreement with the former U.S. Department of Health, Education and Welfare to make disability determinations.
Consequences of Not Funding this ProgramDisability determinations and reviews for federal disability would be performed by another entity, such as an adjacent state. Program GoalsA. Assist individuals with disabilities to gain or regain their independence through employment. B. Provide independent living services to facilitate community inclusion and integration for Kansans with disabilities. C. Perform timely and accurate disability decisions. D. Assure access to qualified sign language interpreters. E. Prepare youth with disabilities to achieve employment and self-sufficiency as adults. Performance Measures
Rehabilitation Services: Rehabilitation Services AdministrationProgram HistoryRehabilitation Services represents the cornerstone of the agency's efforts to help people with disabilities become gainfully employed and self-sufficient. VR services are delivered via local offices through the six DCF regions. VR counselors assist people with disabilities in determining eligibility, assessing their skills and interests, developing individualized plans for employment, and arranging for the services they need to become employed. The VR program is a core partner with other workforce development programs as mandated by the Workforce Innovation and Opportunity Act (WIOA). VR must set aside 15 percent of the VR program federal funds to provide Pre-Employment Transition Services.
Consequences of Not Funding this ProgramThe absence in management of these programs would impair the execution of agency initiatives and policies, as well as the operation of federal programs. Lack of support for the State Rehabilitation Council would result in the failure to secure State Plan approval, and therefore federal VR funds. Program GoalsA. Assist individuals with disabilities to gain or regain their independence through employment. B. Provide independent living services to facilitate community inclusion and integration for Kansans with disabilities. C. Perform timely and accurate disability decisions. D. Assure access to qualified sign language interpreters. E. Prepare youth with disabilities to achieve employment and self-sufficiency as adults. Rehabilitation Services: Rehabilitation Services Case ServicesProgram HistoryThe Rehabilitation Case Services and Client Services programs assist persons with physical or mental disabilities to obtain competitive, integrated employment and live more independently. The Rehabilitation Act is presently included as Title IV of the 2014 Workforce Innovation and Opportunity Act (WIOA). WIOA affirmed the emphasis on competitive, integrated employment outcomes, and made several significant changes including: the addition of Pre-Employment Transition Services for youth with disabilities, the addition of career counseling and information/referral services for individuals with disabilities employed in subminimum wage jobs, and a new emphasis on creating closer connections with employers.
Consequences of Not Funding this ProgramInability to provide services to prepare Kansans with disabilities for competitive integrated employment. Fewer individuals with disabilities employed, resulting in greater reliance on public benefits. Program GoalsA. Assist individuals with disabilities to gain or regain their independence through employment. B. Provide independent living services to facilitate community inclusion and integration for Kansans with disabilities. C. Perform timely and accurate disability decisions. D. Assure access to qualified sign language interpreters. E. Prepare youth with disabilities to achieve employment and self-sufficiency as adults. Performance Measures
Rehabilitation Services: Rehabilitation Services Independent LivingProgram HistoryIndependent Living maximizes the leadership, empowerment, independence and productivity of individuals with disabilities, and furthers their integration and full inclusion into mainstream society. This mission is carried out through a statewide network of ten Centers for Independent Living (CILs) and several other community partners. CILs are not residential facilities. Instead, they offer the following core services: information and referral, individual and systems advocacy, peer support, independent living skills training, youth transition, and services to support deinstitutionalization. The first Kansas CIL was established in Hays in 1980.
Consequences of Not Funding this ProgramKansans with disabilities would be without supports for independence, employment, and self-sufficiency resulting in an increased in the use of public assistance, SSA benefits and other poverty programs. Program GoalsA. Assist individuals with disabilities to gain or regain their independence through employment. B. Provide independent living services to facilitate community inclusion and integration for Kansans with disabilities. C. Perform timely and accurate disability decisions. D. Assure access to qualified sign language interpreters. E. Prepare youth with disabilities to achieve employment and self-sufficiency as adults. Performance Measures
Rehabilitation Services: Services for the BlindProgram HistoryThe Blind Services subprogram supports individuals who are legally blind in pursuing entrepreneurial opportunities and becoming self-reliant under the Business Enterprise Program (BEP). The origin of BEP was the Randolph-Sheppard Act of 1936, which authorized persons who are legally blind to operate vending stands in federal buildings. The Department for the Blind was established in the Kansas Board of Social Welfare in 1939. In 1974, the Blind Services Program was established within the Rehabilitation Services Program.
Consequences of Not Funding this ProgramLoss of employment for blind vendors. Reduced ability to provide timely accommodations. Program GoalsA. Assist individuals with disabilities to gain or regain their independence through employment. B. Provide independent living services to facilitate community inclusion and integration for Kansans with disabilities. C. Perform timely and accurate disability decisions. D. Assure access to qualified sign language interpreters. E. Prepare youth with disabilities to achieve employment and self-sufficiency as adults. Performance Measures
Rehabilitation Services: Workforce Innovation and Opportunity Act RequirementsProgram HistoryThe 2014 Workforce Innovation and Opportunity Act (WIOA) amended the Rehabilitation Act of 1973. Under WIOA, the Vocational Rehabilitation (VR) program is now a core partner with other workforce services operated by the Kansas Department of Commerce and the Kansas Board of Regents. As a result, VR services and resources are required to support the broader workforce system to decrease duplication of effort and maximize the opportunities for Kansans with disabilities to obtain, maintain and regain employment.. An additional requirement under WIOA includes the provision of career counseling and information and referral services targeting workers employed at sub-minimum wage.
Consequences of Not Funding this ProgramFailure to secure State Plan approval and consequently federal VR funds. Inability to provide required career counseling and information and referral services. Program GoalsA. Assist individuals with disabilities to gain or regain their independence through employment. B. Provide independent living services to facilitate community inclusion and integration for Kansans with disabilities. C. Perform timely and accurate disability decisions. D. Assure access to qualified sign language interpreters. E. Prepare youth with disabilities to achieve employment and self-sufficiency as adults. Performance Measures
SPARK Expenditures: Community Resource CapacityProgram HistoryThe expenditures in this program are ARPA State and Local Fiscal Recovery Fund allocations to DCF from the Office of Recovery. This program is designed to accelerate community capacity in health and education programs through one-time funding for programs and facilities serving children or providing enrichment programs. Funds may be utilized for enhancing facilities and expanding projects for organizations that provide health, education and/or early childhood services to Kansans
Consequences of Not Funding this ProgramThe effects of the pandemic on clients and DCF operations would be more severe. SPARK Expenditures: Eligibility Applications BacklogProgram HistoryThe expenditures in this program are ARPA State and Local Fiscal Recovery Fund allocations to DCF from the Office of Recovery. These funds will be used to procure consulting and training services to review business processes. A determination will be made regarding the factors which may be contributing to a growing backlog of applications with DCF. Recommendations will be made to improve DCF office capacity and efficiency.
Consequences of Not Funding this ProgramThe effects of the pandemic on clients and DCF operations would be more severe. Transfers to Other State AgenciesProgram HistoryProvides federal funding to other state agencies for a range of services.
Consequences of Not Funding this ProgramSeveral federal requirements would not be met, program goals would not be achieved, and some programs performed by other agencies would not be funded. Department of LaborAdministrationProgram HistoryThe Kansas Department of Labor was created by Executive Order No. 31 of 2004. The Legislature enacted the change to implement the order and it became effective on July 1, 2004. The order renamed the Department of Human Resources to the Kansas Department of Labor and transferred the Division of Employment and Training to the Department of Commerce and transferred the Kansas Advisory Commission on Hispanic/Latino Affairs and the Kansas African American Affairs Commission to the Department of Administration. In July 2005, America's Job Link Alliance - Technical Services (AJLA-TS) was also transferred to the Department of Commerce to be more in line with workforce development and the Employment and Training programs.
Consequences of Not Funding this ProgramLack of oversight for the Kansas Department of Labor. May create a loss of revenue from unemployment insurance and workers compensation assessments or mismanagement of funds, lack of clarity and inadequate information processing systems. Program GoalsA. The Administrative and support services are responsible for providing support to program staff to ensure KDOL fulfills its mission. B. The Kansas Department of Labor provides workers and employers with information and services that are accurate and timely, efficient and effective, fair and impartial. Administered by employees that understand the value and importance of public service to their fellow Kansans. Industrial Safety and HealthProgram HistoryThe Kansas Department of Labor was created by Executive Order No. 31 of 2004. The Legislature enacted the change to implement the order and it became effective on July 1, 2004. The order renamed the Department of Human Resources to the Kansas Department of Labor and transferred the Division of Employment and Training to the Department of Commerce and transferred the Kansas Advisory Commission on Hispanic/Latino Affairs and the Kansas African American Affairs Commission to the Department of Administration. In July 2005, America's Job Link Alliance - Technical Services (AJLA-TS) was also transferred to the Department of Commerce to be more in line with workforce development and the Employment and Training programs.
Consequences of Not Funding this ProgramThe private industry would not have OSHA consultation services and would result in increased work related injuries. Educational information supplied by the department would not be up to date. Investigations would not be completed and inspections would not take place. Program GoalsA. To assist and encourage employers in their efforts to assure safe and healthful workplaces in Kansas. B. To maintain the availability of on-site consultation services pursuant to the federal contract. C. To encourage employers to develop, use and maintain workplace safety and health plans related to the nature of the employment. D. To review maintenance, operations, and qualifications of inspections conducted by a third party in accordance with the Kansas Amusement Ride Act, KSA 44-1601 et seq. Performance Measures
Labor Market InformationProgram HistoryThe Kansas Department of Labor was created by Executive Order No. 31 of 2004. The Legislature enacted the change to implement the order and it became effective on July 1, 2004. The order renamed the Department of Human Resources to the Kansas Department of Labor and transferred the Division of Employment and Training to the Department of Commerce and transferred the Kansas Advisory Commission on Hispanic/Latino Affairs and the Kansas African American Affairs Commission to the Department of Administration. In July 2005, America's Job Link Alliance - Technical Services (AJLA-TS) was also transferred to the Department of Commerce to be more in line with workforce development and the Employment and Training programs. The law establishing the agency is sections 75-5701 through 75-5740 of Kansas Statutes Annotated. The Department administers the Kansas Employment Security Law, KSA 44-701, et seq.; the Workers Compensation Act, KSA 44-501, et seq.; the Wage Payment Act KSA 44-313, et seq.; Minimum Wage and Maximum Hours Act, KSA 44-1201, et seq.; Child Labor Act, KSA 38-601, et seq.; private employment agencies, KSA 44-401, et seq.; labor relations, KSA 44-801, et seq.; Public Employer-Employee Relations Act, KSA 75-4321, et seq.; Professional Negotiations Act, KSA 72-5413, et seq.; Kansas Amusement Ride Act, KSA 44-1601, et seq.; several statutes concerning inspections and safety at work sites including KSA 44-631, 44-634, 44-636 through 44-638; providing consultation to further 2012 Senate Bill 155; and the human trafficking advisory board, KSA 75-757.
Consequences of Not Funding this ProgramNo data would be available regarding the status of the labor force and economy. Program GoalsA. Provide accurate and timely labor market information in response to user requests, and disseminate data using appropriate media. Performance Measures
Labor RelationsProgram HistoryThe Kansas Department of Labor was created by Executive Order No. 31 of 2004. The Legislature enacted the change to implement the order and it became effective on July 1, 2004. The order renamed the Department of Human Resources to the Kansas Department of Labor and transferred the Division of Employment and Training to the Department of Commerce and transferred the Kansas Advisory Commission on Hispanic/Latino Affairs and the Kansas African American Affairs Commission to the Department of Administration. In July 2005, America's Job Link Alliance - Technical Services (AJLA-TS) was also transferred to the Department of Commerce to be more in line with workforce development and the Employment and Training programs.
Consequences of Not Funding this ProgramKDOL would not be able to fulfill the statutes governing employment standards and labor relations. Employees would have no outlet for restitution. Hearings would not be conducted. Program GoalsA. To continue to administer both the PNA and the PEERA in a timely, effective and unbiased manner consistent with the legislative intent for enacting these laws. B. To promote harmonious and cooperative employer/employee relationships and enforce laws providing protection to the Kansas work force through due process of administrative proceedings as provided by the following statutes:(1) KSA 44-801 et seq. - Collective Bargaining - Private Sector; (2) KSA 44-818 et seq. - Agricultural Labor Relations Act; (3) KSA 75-4321 et seq. - Public Employer-Employee Relations Act; (4) KSA 22-5413 et seq. - Professional Negotiations Act; and (5) KSA 77-501 et seq. - Kansas Administrative Procedure Act. Performance Measures
Unemployment InsuranceProgram HistoryThe Kansas Department of Labor was created by Executive Order No. 31 of 2004. The Legislature enacted the change to implement the order and it became effective on July 1, 2004. The order renamed the Department of Human Resources to the Kansas Department of Labor and transferred the Division of Employment and Training to the Department of Commerce and transferred the Kansas Advisory Commission on Hispanic/Latino Affairs and the Kansas African American Affairs Commission to the Department of Administration. In July 2005, America's Job Link Alliance - Technical Services (AJLA-TS) was also transferred to the Department of Commerce to be more in line with workforce development and the Employment and Training programs.
Consequences of Not Funding this ProgramLack of supervision of the unemployment insurance program could result in fraud, waste and abuse of the program. The new hires database would not be up to date. Unemployment insurance documents would not be processed. Claimant unemployment applications would not be processed. Unemployment Insurance would not be adequately funded. Program GoalsA. To continue to improve and enhance the levels of customer service provided to Kansas employers and workers who interact with the agency. B. To continue to build upon recent successes in meeting and exceeding federally mandated program performance standards. C. To continue to work with the Office of Information Technology Services to make incremental improvement in the existing technology platforms that support the unemployment system in Kansas. Performance Measures
Workers CompensationProgram HistoryThe Kansas Department of Labor was created by Executive Order No. 31 of 2004. The Legislature enacted the change to implement the order and it became effective on July 1, 2004. The order renamed the Department of Human Resources to the Kansas Department of Labor and transferred the Division of Employment and Training to the Department of Commerce and transferred the Kansas Advisory Commission on Hispanic/Latino Affairs and the Kansas African American Affairs Commission to the Department of Administration. In July 2005, America's Job Link Alliance - Technical Services (AJLA-TS) was also transferred to the Department of Commerce to be more in line with workforce development and the Employment and Training programs.
Consequences of Not Funding this ProgramLack of funding would result in fraud, waste and abuse of the program. Worker's Compensation Professionals would have to find other educational services. Program GoalsA. Provide a statewide judicial system for workers compensation claims that operates in a fair and efficient manner. B. Establishment and publication of a medical fee schedule for care involving injured workers. C. Regulatory oversight, including employer compliance with mandatory workers compensation insurance coverage, self-insurance permitting, and insurer accident prevention programs. Performance Measures
Health & Environment--HealthHealth Care Finance: Administration
Consequences of Not Funding this ProgramWill not be able to supply adminstrative support and financial services to all of DHCF's program areas. Will not be able to compute the fiscal impact of proposed policies, forecast caseloads, provide analytical support to program managers, and will not be able to respond to requests from stakeholders within or outside DHCF. Will not be able to oversee numerous programs and activities which spend Medicaid and CHIP funds and ensure adherence to state and federal regulations. Program GoalsA. Improve the health of the people of Kansas by increasing the quality, efficiency and effectiveness of health services. B. Increase coordination with public health programs. Performance Measures
Health Care Finance: MedicaidProgram HistoryMedicaid was formed as a result of the Social Security Act and was originally administered by the Department of Social and Rehabilitative Services (SRS). Later it was administered by the Kansas Health Policy Authority (KHPA). It is currently administered by the Division of Health Care Finance within the Kansas Department of Health and Environment. The 2011 Legislature approved the Governor's Executive Reorganization Order 38 to merge the Kansas Health Policy Authority into the Kansas Department of Health and Environment. Nearly all health care services purchased by KanCare are financed through a combination of State and federal matching dollars either through Title XIX (Medicaid) or Title XXI, the Children's Health Insurance Program (CHIP). Title XXI was created by Congress as part of the Balanced Budget Act to address the growing problem of children without health insurance. It was designed to expand health insurance to children whose families do not qualify for Medicaid. Coverage through CHIP is provided to "targeted low-income children," specifically those who reside in families with income below 200 percent of the Federal Poverty Level (FPL) or those whose families have an income 50 percent higher than the State's Medicaid eligibility threshold. Recent legislation includes the passage in 2015 of Senate Sub for HB 2149 that amends the procedures regarding restrictions of patients' access to any new prescription-only drug under the Kansas Medicaid Program and establishes meeting requirements for the Medicaid Drug Utilization Review Board. The bill also allows prior authorization or other restrictions on medications used to treat mental illness to be imposed on Medicaid recipients subject to guidelines developed by the Board. The legislation creates a Mental Health Medication Advisory Committee to look at restrictions and authorizations for Medicaid recipients.
Consequences of Not Funding this ProgramWould not be able to purchase medically necessary services for eligible consumers and provide access to treatment programs and preventative services. Also, many children would be without health insurance if the CHIP program was not funded. Program GoalsA. Improve the quality of care for all Kansans. B. Control program costs. C. Implementing long-lasting reforms that improve the quality of health and wellness of Kansans. Performance Measures
Public Health: Bureau of Community Health SystemsProgram HistoryThe Bureau of Community Health Systems (BCHS) provides programmatic alignment for improved coordination of programs and services continues to grow with in this bureau. BCHS is a merge of multiple offices and bureaus over the years and currently made up of seven sections: Administration, Community Health Access, Health Facilities, Local Public Health, Public Health Preparedness, Radiation Control, and Trauma Systems. The bureau provides programmatic leadership for the agency in public health and hospital preparedness program, which coordinates response to all public health and radiation emergency situations, whether caused by natural events or acts of terrorism. There is close collaboration with other federal, state, and local partners, including the Wolf Creek nuclear generating station. BCHS staff work regularly with local public health departments, hospitals, clinics, associations, universities, and other partners to further public health in Kansas.
Consequences of Not Funding this ProgramShould the initiatives within the Bureau of Community Health Systems not be funded, there would ultimately be a decrease of services available in Kansas. Safety Net Clinics who provide primary, dental, prescription and preventative health care to uninsured and underinsured populations would be affected and further increase health disparities for at risk populaitons. Trauma centers in Kansas would no longer be designated which is the only guarantee a hospital is abiding by the standards in medical care for injured patients. Some health facilities in Kansas would not be surveyed which would potentially decrease access to healthcare and increase the risk in those facilities. Local health departments would not have access to funding and assistance to enable them to provide adequate public health services to all inhabitants of Kansas as required by statue. Program GoalsA. Enhance the health and safety of Kansas communities. B. Strengthen the public health system through collaboration, support, and monitoring. C. Partner with the state and local public health community to coordinate programs. Performance Measures
Public Health: Bureau of Disease Control and PreventionProgram HistoryThe Bureau of Disease Control and Prevention (BDCP) is the operating unit principally responsible for programs designed to prevent and control communicable diseases of crucial public health concern. In 2022, the Bureau was reconfigured into five programmatic sections: the Disease Intervention Section, the Administrative Support Section, the Prevention and Care Section, the Immunizations Section, and the Infectious Disease Management Section.
Consequences of Not Funding this ProgramWithout public health intervention, disease transmission rates will increase dramatically resulting in significant morbidity and mortality (including infant) from these infections. As a result, the cost of treating outbreaks of these diseases will also dramatically increase. Thousands of parents statewide would be unable to afford the costs associated with vaccine acquisition, resulting in a significant drop in immunization coverage rates. Decreases in immunization coverage rates will ultimately result in increased outbreaks of vaccine-preventable diseases, resulting in significant morbidity and mortality. Program GoalsA. To intervene in the spread of STIs, including HIV, and reduce the complications occurring from these infections. B. Prevent morbidity and mortality due to tuberculosis and contain the incidence of multi-drug resistant tuberculosis. C. Reduce the incidence of vaccine preventable disease (VPD). Performance Measures
Public Health: Bureau of Facilities and LicensingProgram HistoryIn November 2022, the Health Facilities Program was changed to the Bureau of Facilities and Licensing (BFL) and broken out from the Bureau of Community Health Systems. BFL ensures compliance with State licensing laws and Federal certification regulations for the Centers for Medicare and Medicaid Services (CMS) for all acute and continuing healthcare (ACC) provider/supplier types. The provider/supplier types the Bureau maintains jurisdiction over include acute and specialty hospitals, organ transplant centers, critical access hospitals, rural emergency hospitals, home health and hospice agencies, ambulatory surgical centers, rural health clinics, free-standing birth centers, Intermediate Care Facilities for Individuals with Intellectual Disabilities, End State Renal Disease facilities, outpatient physical therapy, comprehensive outpatient rehabilitation facilities and portable x-ray providers. Health facility surveyors (HFS) document compliance with state regulations and federal certification standards through the survey process. This program conducts surveys of allegations of abuse, neglect, or exploitation occurring in these ACC provider/supplier types. This program manages all new construction, renovation, and remodeling projects as well as conducts surveys to ensure compliance with federal Life Safety Code requirements.
Consequences of Not Funding this ProgramShould the Bureau of Facilities & Licensing not be funded, health facilities in Kansas would not be surveyed, which would potentially decrease access to healthcare and increase the risk in the facilities. Program GoalsA. Protect Kansans from public health hazards. B. Protect Kansans from identity theft. C. Collect, analyze and disseminate public health data. Performance Measures
Public Health: Bureau of Family HealthProgram HistoryAs of SFY2023, the Bureau of Family Health (BFH) is comprised of four large sections and two support units which include comprehensive, complex programs and broad activities: Children & Families, Screening and Surviellence, Nutrition & WIC Services, Early Care & Youth Programs (Child Care Licensing), Administration & Policy (support unit) and Systems of Support (support unit). A number of statewide programs in the Bureau are authorized and/or mandated by State and/or Federal Laws. Programs and projects administered through the Bureau meet the needs of infants, children, adolescents, women, pregnant women, men, individuals with special health care needs, and families birth to 44 years of age. Programs are targeted to the highest risk populations accessing and receiving care and services throughout the lifespan. Programming integrates social determinants of health and heath equity in an effort to address and eliminate ethic/racial and socioeconomic health disparities. The Bureau organization has been impacted by an Executive Reorganization Order (ERO) twice and multiple internal agency changes since 2012. Prior to 2012, BFH programming did not include the Child Care Licensing or Foster Care Licensing programs. These programs were previously organized as part of the Bureau of Child Care and Health Facilities (BCCHF) which also included the Health Occupations Credentialing Program. ERO 41 (effective July 2012) included reassignment of the Health Occupations Credentialing (HOC) Program, licensure and certification of long term care personnel and the criminal record check program, to the Kansas Department of Aging & Disability Services (KDADS). With the reassignment of the HOC Program to KDADS, some internal reorganization at KDHE was needed. The decision was made to pair the remaining BCCHF regulatory programs (Child Care Licensing, Foster Care Licensing, and Health Facilities [hospital and medical facility licensing]) with like services in other bureaus. The Health Facilities Program joined the Bureau of Community Health Systems. The Child Care and Foster Care Programs joined the Bureau of Family Health due to the strong alignment with other Family Health programs. Merging BCCHF programs with BFH, resulted in Bureau-level changes for Family Health effective in July 2012 (reorganized programs within sections to improve alignment and coordination/collaboration across programs serving similar populations). Additional agency changes occurred in February 2015. The Bureau of Environmental Health (BEH) was dissolved and programs were integrated into existing Bureaus. The Lead Hazard Prevention Program (LHPP) became part of the BFH. ERO 43 was issued in 2015 (effective July 1, 2015) which, among other things, moved the Foster Care Licensing Program from KDHE to the Department for Children and Families. Effective October 2019, the Lead Hazard Prevention Program was moved from BFH to the Division of Environment's Bureau of Air.
Consequences of Not Funding this ProgramFamily Health programming encompasses a wide variety of critical public health programs impacting health and outcomes across the lifecourse (birth to adulthood). Without funding, infants born in Kansas would not be screened for 34 genetic/metabolic conditions, 16 of which are time-sensitive/critical. Lack of funding would hamper early diagnosis and treatment, leading to severe illness, delays/disabilities or even death. Regular on-site facility inspections for nearly 4,600 facilities serving children 2 weeks to 11 years of age would not be conducted. Inspections are a safeguard to ensuring the health, safety and wellbeing of children in out of home care. Parents would not have access to quality child care. Child care facilities would not be licensed, increasing preventable risk to children in care as well as negatively impacting the economy and parents' ability to work away from the home. Without WIC funding all program services would cease, infant outcomes will be negatively impacted, and childhood nutrition will suffer. In 2021, the WIC program served a monthly average of 45,124 participants in 29,342 households. Part C early intervention programs across the state (33) would not receive funding necessary to maintain and implement a system of coordinated, comprehensive, multidisciplinary early intervention services for infants and toddlers with disabilities (birth through 2 years) and their families. Consequently, over 10,000 children would not receive services. Maternal and Child Health (MCH) services that support healthy pregnancies, postpartum mothers, breastfeeding mothers, and their children and familes (over 79,000 Kansans) would not be available. MCH serves as a gap-filling program that ensures access to care for individuals without the financial means or healthcare coverage to obtain services otherwise. Support for preventative health services (annual well visits) including reproductive health services would not be provided statewide through more than 42 local agencies with 53 service sites. Reproductive health and family planning clinical care constitutes primary care (and in some cases, the only clinical care) for many of the low-income clients served. Services that would be significantly impacted and/or no longer provided at these clinical sites include: health assessments; cancer screenings; pregnancy testing and appropriate counseling; information regarding early and continuous prenatal care in cases of a positive pregnancy test and/or exam; FDA-approved contraceptive methods and counseling (effectiveness, proper use, indications/precautions, risks, benefits, possible minor side effects, and potential life threatening complications); screening and treatment for HIV and sexually transmitted diseases; and immunization education/referrals. There would be negative impact on an additional 1,500 - 3,000 individuals birth to 22 years who attend special health care needs clinics and receive diagnostic evaluations. Over 250 children with special health care needs would not have access to care coordination services and financial support for medically necessary services and treatments through Direct Assistance Programs. Program GoalsA. Facilitate access to comprehensive and coordinated clinical and public health services; improve access to comprehensive screening including health, social, developmental, and behavioral; promote policies, systems, and resources to meet the needs of Kansas women, men, children, and families. B. Protect and promote public health and the optimal development of children in out of home care through the inspection and licensing of child care facilities; provide a basic level of consumer protection for parents and guardians selecting child care. C. Strengthen Maternal and Child Health infrastructure and systems to eliminate barriers to health care and disparities for individuals birth through adulthood, especially those with special health care needs. D. Improve access to comprehensive and quality nutritional services for women, mothers, and children. Performance Measures
Public Health: Bureau of Health PromotionProgram HistoryHistory: The Bureau of Health Promotion was established in 1989. State FY1990 was the first year BHP was shown in the budget. The state health promotion "office" started with about $250,000 of PHHSBG and has grown to a Bureau with over $20 million being invested in Kansas for prevention and control of chronic disease, injury and violence, drug overdose, and associated risk factors. The vast majority of funds are from federal and private sources such as foundations. Work is accomplished through partnerships with the people of Kansas to promote healthy behaviors, policies, and environmental changes within communities and health systems that improve the quality of life and prevent chronic disease, injury, and premature death. Support for proven strategies such as community health workers and new initiatives such as suicide prevention and palliative care have been incorporated over time to address emerging needs.
Consequences of Not Funding this ProgramChronic Disease and Injury Risk Reduction: 6,300 Seniors would not receive vouchers for fruits and vegetables through the Senior Farmers Market Nutrition Program and 250 farmers would lose sales. Over 10,000 Kansans annually would not have enrolled in proven lifestyle change programs and behavior change trainings such as the Diabetes Prevention Program, Diabetes Self-Management Education, Tobacco Quitline, Zero Suicide, Stepping On and would be at increased risk of severe illness or death. Over 3,500 unintentional injury prevention interventions (smoke alarms, carbon monoxide detectors, bicycle helmets, child safety seats) would not have been received which would increase the number of childhood injuries and deaths. Health Systems Approaches to Chronic Disease and Injury Control Programs: Over 10,000 fewer cancer screenings for low income, uninsured men and women annually. This would result in breast, cerivical, and colorectal cancer diagnoses at later stages of the disease when treatment is more costly and less effective. Fewer providers would refer patients to tobacco cessation programs. Reductions in opioid prescriptions would not be maintained. Societal, Policy, and Surveillance to reduce Chronic Disease and Injury Program: If chronic disease, injury, and violence data systems were not funded, Kansas decision-makers and program directors at the local and state levels would not have current information for planning, implementation, and evaluation of programs designed to improve the health of Kansans. Program GoalsA. Chronic disease and injury risk reduction program: Decrease the prevalence of health risk behaviors which contribute to the leading preventable chronic diseases and injury in the Kansas population. B. Health systems program: Increase access to preventive health services and reduce the health impact of chronic disease and injury among Kansans. C. Societal, Policy, and Surveillance Program: Assess the burden, monitor progress, and make recommendations towards achieving state health objectives that address chronic disease and injury in Kansas. Performance Measures
Public Health: Bureau of Oral HealthProgram HistoryHistory: In 2003, KDHE worked with KS legislature to secure support for a dental health officer. Funding for a state dental officer was provided through the legislature and United Methodist Health Ministry Fund(no longer funding). In 2019 the Bureau of Oral Health experienced 100% turnover, resulting in the hiring of a third Bureau director who continues to serve in that role.
Consequences of Not Funding this ProgramConsequences of Not Funding this program causes the Bureau of Oral Health to lose the ability to conduct, collect, analyze and disseminate the oral health status of KS children would be greatly diminshed. The school sealant program, community water fluoridation projects, technical assistance and support from dental director and program managers would be adversely affected. State wide data collection, analysis and dissemination of oral health status of children, elderly, workforce assessments, community water fluordiation reporting, KS data to national agencies, organizations, funders, policy makers and surveillance systems would be eliminated. The state agency conducts scientific, evidence- based surveillance on oral health and disease issues that are credible and acountable in their accuracy and objectivity. Program GoalsA. Outreach. B. Data/Surveillance. Performance Measures
Public Health: Epidemiology and Public Health Informatics (BEPHI)Program HistoryThe Bureau of Epidemiology and Public Health Informatics (BEPHI) consists of three core functions of public health activities that comprise 1) infectious disease and disease condition identification and management; 2) vital records registration, issuance, and statistical analysis; and 3) health assessment and information dissemination. Funding sources for these programs include federal cooperative agreements, state fees, and administrative contracts. These core public health functions were begun when the Kansas State Board of Health was established in the early 1920s. KDHE was established in 1974 to bring together health and environmental perspectives in assuring the public's health. The Epidemiology and Public Health Informatics programs were merged in 2010 to form BEPHI to meet a growing need to coordinate and streamline several key public health information systems for Kansas. BEPHI's core functions provide direct service to the citizens of Kansas and heavily utilize health information systems to deliver these services. Real time, web-based systems provide capacity to identify and contain infectious disease outbreaks, register and issue vital event records, monitor blood lead leavels in children and adults and standardize epidemiologic applications within programs in KDHE. BEPHI is responsible for collecting , analyzing, and interpreting data that provide information on a variety of conditions of public health importance and on the health status of the population. The Bureau conducts, in partnership with local health departments and other state and federal agencies, timely investigations of and surveillance related to infectious and zoonotic diseases, environmental health, maternal and child health, trauma, and other public health hazards.
Consequences of Not Funding this ProgramConsequences of not performing the tasks would result in Kansas citizens not having identities established; death records for reconcilliation of estates would not be available and fraud prevention activities for benefits paying agencies would cease. Surveillance and epidemiology is a core public health function for Kansas and the nation. Consequences of not funding these activities at the State level could result in additional outbreaks of or larger impacts of outbreaks of infections disease. Investigations regarding impacts of environmental concerns could not be conducted, leading to increased concerns among the public and continued health risks. Preparedness activites for prevention and control of high consequence pathogens would go unaddressed, resulting in unnecessary morbidity and mortality for Kansas citizens. Program GoalsA. Protect Kansans from public health hazards. B. Protect Kansans from identity theft. C. Collect, analyze and disseminate public health data. Performance Measures
Public Health: Office of Laboratory Services (Kansas Health and Environment Laboratories)Program HistoryHistory: The first biological and chemical analyses for Public Health and Protection were performed in 1886 at the Kansas Board of Health. In 1907, the Environmental Microbiology laboratory began analyzing water and wastewater for public health as a part of the Division of Sanitation. This was the first lab that would become what is now Kansas Health and Environmental Laboratories (KHEL). When the Kansas Department of Health and Environment was established by legislative action in 1974, the combined health and environmental laboratory was located in the Forbes Field complex. Named in statutes as the Office of Laboratory Services, the Division of Health and Environmental Laboratories became part of the Division of Environment in FY 2007. The total funding shown for the program in FY 2020 through FY 2023 represents COVID funding to support not only the laboratory operations but many supplies and equipment provided to partners throughout the state to fight the COVID 19 Pandemic.
Consequences of Not Funding this ProgramInfants could go undiagnosed and experience permanent or life threatening disorders. The public would have greater exposure to viruses and diseases. Outbreaks could go undetected due to no investigative testing capacity. Increase risk and cost to Kansans due to poor water quality and decreased monitoring. Public Water Suppliers would have to find outside laboratories to perform testing and Kansas would have to contract with and designate a Primacy Laboratory or else have the program taken over by EPA. EPA would take over drinking water program, Clinical Testing Labs would not be evaluated for accurate performance, intoxicated drivers would remain on the highways. Program GoalsA. Protect Kansans from public health hazards. B. Protect Kansans from identity theft. C. Collect, analyze and disseminate public health data. Performance Measures
Kansas Guardianship ProgramAdministrationProgram HistoryThe Kansas Guardianship Program was initiated in 1979 under the administration of Kansas Advocacy and Protective Services, Inc. In 1995, the Kansas Legislature established the program as a public instrumentality through passage of KSA 74-9601 et seq., as amended. The KGP is governed by a seven-member board of directors, six of whom are appointed by the Governor and one by the Chief Justice. The purpose of the program is to recruit volunteers to serve as court appointed guardians or conservators for those eligible persons adjudicated by the court in need of this level of protection and advocacy. KSA 59-3069 (g) provides that State serves as serve as surety on the bond of any conservator serving in the Kansas Guardianship Program. KSA 75-6101(d)(4) added court-appointed guardians and conservators who contract with the Kansas Guardianship Program to the definition of "employee" in the Kansas Tort Claims Act. This allows the program volunteers to be protected in cases of negligence or acts of omission.
Consequences of Not Funding this ProgramKansas is unique in the country in that, on a statewide basis, citizen volunteers are appointed guardians or conservators for those program eligible persons adjudicated by the court and in need of this level of protection and advocacy. This volunteer-based model of providing guardianship or conservatorship services involves a collaborative working relationship with the Department of Children and Families (DCF) and the Kansas Department for Aging and Disability Services (KDADS). Persons served by the KGP are identified by DCF Adult Protective Services and State hospital social workers who then make formal requests to the KGP for an approved volunteer who may be nominated to the court for appointment as guardian or conservator. The individuals served are dependent upon public support. Individuals Served: During FY 2023, the program provided guardianship or conservatorship services to 1288 different individuals through the efforts of more than 717 Kansas citizens (KGP volunteers) appointed by the court as the guardian or conservator. A monthly stipend is made available to volunteers to off-set out-of-pocket expenses. The agency funding provides for the operational budget for salaries and wages, contractual services, commodities, and capital outlay. This volunteer-based program model provides a cost-effective guardianship or conservatorship service for vulnerable at-risk adults who do not have willing and able family members available or appropriate to be appointed by the court. The consequences of not funding this program would result in the agency discontinuing all services and supports. 1) The current case load of individuals receiving guardianship or conservatorship services would no longer have agency staff to provide support and assistance to the volunteers serving as guardians or conservators. Volunteers accept this responsibility with the understanding staff support and technical assistance will be available to assist in navigating the complexities of supports and services for vulnerable individuals served. Volunteers wishing to resign/discontinue serving as guardian or conservator would have no available mechanism to identify a successor guardian nominee. 2) The stipend funding would no longer be available to volunteers for out-of-pocket expenses. 3) Referrals Discontinued - No new referrals may be made for a guardian nominee available to provide guardianship or conservatorship services. 4) Ten agency staff would no longer be available to provide support and assistance to existing volunteer, recruit new volunteers and manage new referrals for guardian or conservator nominee. Program GoalsA. To provide that qualified, caring, and trained persons are available throughout the State who will volunteer to serve in the capacity of court appointed guardians or conservators for those program eligible persons in need of this level of protection and advocacy, and who do not have family members capable or willing to assume such responsibilities. All such persons are identified by DCF adult protective services or KDADS state hospital social workers and referred to the KGP after all other alternatives have been exhausted. Legal services are provided through the State to petition to the court for the trial to determine impairment. Individuals served may be considered the adult wards of the State. Performance Measures
Kansas Neurological InstituteAdministrationProgram HistoryKNI is certified by the federal government as an Intermediate Care Facility for Individuals with Intellectual Disabilities (ICF/IID) under Title XIX of the Social Security Act.
Consequences of Not Funding this ProgramKNI would have to close, which would place a burden on the community to place them in another facility that would be able to meet their medical and physical needs. It would also eliminate 437.5 FTE positions and lay off staff. Program GoalsA. Maintain adequate staffing levels to be in compliance with ICF-MR rules and regulations. Performance Measures
Ancillary ServicesProgram HistoryKNI is certified by the federal government as an Intermediate Care Facility for Individuals with Intellectual Disabilities (ICF/IID) under Title XIX of the Social Security Act.
Consequences of Not Funding this ProgramKNI would have to close, which would place a burden on the community to place them in another facility that would be able to meet their medical and physical needs. It would also eliminate 437.5 FTE positions and lay off staff. Program GoalsA. To provide clinical and therapeutic staff for all the people who live at KNI. B. Provide support for residents in all aspects of finding, securing, and retaining individualized and meaningful employment. C. Engaging community people, to provide a high quality volunteer experience that will enrich the lives of the volunteers and people with intellectual disabilities. Performance Measures
Medical and Surgical ServicesProgram HistoryKNI is certified by the federal government as an Intermediate Care Facility for Individuals with Intellectual Disabilities (ICF/IID) under Title XIX of the Social Security Act.
Consequences of Not Funding this ProgramKNI would have to close, which would place a burden on the community to place them in another facility that would be able to meet their medical and physical needs. It would also eliminate 437.5 FTE positions and lay off staff. Program GoalsA. Provide health care for people who live at KNI with various types of acute and chronic conditions and to provide intermediate health care 24 hours a day, 7 days a week. Performance Measures
Physical Plant and Central ServicesProgram HistoryKNI is certified by the federal government as an Intermediate Care Facility for Individuals with Intellectual Disabilities (ICF/IID) under Title XIX of the Social Security Act.
Consequences of Not Funding this ProgramKNI would have to close, which would place a burden on the community to place them in another facility that would be able to meet their medical and physical needs. It would also eliminate 437.5 FTE positions and lay off staff. Program GoalsA. Maintains the facilities and vehicle fleet. B. Procure, store, and issue all commodities and equipment at the facility. C. Provides 24/7 security services. Performance Measures
Program and Supported LivingProgram HistoryKNI is certified by the federal government as an Intermediate Care Facility for Individuals with Intellectual Disabilities (ICF/IID) under Title XIX of the Social Security Act.
Consequences of Not Funding this ProgramKNI would have to close, which would place a burden on the community to place them in another facility that would be able to meet their medical and physical needs. It would also eliminate 437.5 FTE positions and lay off staff. Program GoalsA. To Provide quality supports for the people living at KNI in daily needs and decision-making. Performance Measures
Staff Ed & ResearchProgram HistoryKNI is certified by the federal government as an Intermediate Care Facility for Individuals with Intellectual Disabilities (ICF/IID) under Title XIX of the Social Security Act.
Consequences of Not Funding this ProgramKNI would have to close, which would place a burden on the community to place them in another facility that would be able to meet their medical and physical needs. It would also eliminate 437.5 FTE positions and lay off staff. Program GoalsA. Provide training to KNI staff to ensure they develop and maintain the skills necessary to provide high quality person-centered services to people who live at KNI. KNI hired a new Director of Training, and the Director is editing the curriculum and modifying the classes required for new employees. This performance measure for Staff Education and Research are being revised. B. Provide training to community agency staff to ensure agency staff develop and maintain the skills necessary to provide quality person-centered services to people in the community. Performance Measures
Larned State HospitalAdministrationProgram HistoryThe Administrative Program service includes key support areas that were established upon the creation of Larned State Hospital and provide the continuous oversight in the level of service quality, care, and effectiveness for the mental health needs of the patients and residents at LSH.
Consequences of Not Funding this ProgramWithout the funding of this program, LSH would not be able to ensure that patients and residents receive high quality services that meet the standard of care expectation and are provided by staff members that fulfill the qualifications of their specific job titles and specialty work. Program GoalsA. Effectively process and manage documentation associated with the patient/resident's medical record. B. Identify and pursue opportunities for quality improvement across the services provided to patients and residents at LSH. C. Effectively assess reports of suspected reportable incidents to ensure proper Standard of Care is met for patients and residents. D. Maintain accreditation, licensure and certification. Performance Measures
Ancillary ServicesProgram HistoryThe Ancillary Services have been a cornerstone of Larned State Hospital in its efforts to properly address the various mental, emotional, and physical needs of the patients and residents. These services assist in providing for the overall well-being through proper care and treatment from the medical team, interventions through psychotropic medications and psychotherapy, focuses on activity therapy services, spiritual support, and access to additional community based services as they may be needed. These services greatly assist in the recovery and coping approaches with mental health challenges.
Consequences of Not Funding this ProgramThe Ancillary Services Program entails a large amount of support provided to patients and residents in efforts to support their physical, mental, and emotional well-being. All of the services within the program assist with providing a wholesome approach to patient and resident care. Without funding of this program, the quality of service to patients and residents will be largely hindered and place LSH in violation of regulation and guidelines that must be met for entities such as TJC, KDHE, CMS, etc. Program GoalsA. To properly assess, provide, and refer patients/residents for proper medical treatment of acute, chronic and emergent needs while in the care of LSH. B. Ensure thorough and high quality assessments are completed to verify treatment approaches are appropriate and suitable for each patient/resident. C. To provide a wholesome approach of treatment services that aid in improving mental and emotional well-being through the use of psychology approaches, activity therapy, social services, spiritual, etc. Performance Measures
Physical Plant and Central ServicesProgram HistoryThe Physical Plant-Central services includes key support services that are required for effective functioning of the LSH Hospital. The specific departments within this program ensure that patients/residents of LSH remain in a safe and secure environment that is properly maintained and provides for their daily needs of food, clothing, and shelter.
Consequences of Not Funding this ProgramWithout the funding of this program, LSH would not be able to sustain or provide the basic needs of the patients and residents which includes food, clothing, and shelter. Consequently, needs of greater complexity (medical, mental, emotional) could not be provided and the facility could not serve its purpose to the community members of Kansas. Program GoalsA. Sustain the facilities utilized across campus including both patient occupied buildings and support services. B. Ensure proper dietary needs are met to sustain physical health. C. Provide adequate care of clothing needs to help sustain comfort, cleanliness, and dignity. D. Provide daily security surveillance and oversight to ensure safety of patients, residents, and staff. Performance Measures
Psychiatric Services ProgramProgram HistoryThe Psychiatric Services Program (PSP) was authorized in 1914. PSP provides psychiatric treatment to Kansas citizens 18 years of age or older. Those receiving PSP services are admitted from 61 western Kansas counties. PSP has a budgeted bed capacity of 90 but due to current acquity and staffng shortages the availabe beds are currently 74. Service units include a 30 bed Crisis Stabilization Unit (CSU) for acute stabilization and treatment and two Adult Treatment Units for patients with chronic conditions budgeted for 30 beds each. Patients are admitted to PSP for both evaluation and inpatient treatment. Preadmission screening is completed by the Community Mental Health Center (CMHC). A CMHC screening is required by law to authorize admission to the PSP. Adults may be admitted either on a voluntary basis or by civil commitment. Patients may have a variety of symptoms due to mental illnesses, such as, but not limited to, schizophrenia, bipolar disorder, traumatic brain injury, major depression and post-traumatic stress disorder. Symptoms are often severe and may include hallucinations, delusions, suicidal ideation and other behavioral problems. Adult psychiatric patients are admitted through a triage area and a determination is made regarding treatment options and unit placement. Social detoxification services are provided for up to 72 hours within the PSP at LSH for persons referred by law enforcement agencies or by a district court.
Consequences of Not Funding this ProgramPsychiatric Services Program (PSP) at LSH serves patients from a 61 county catchment area whom have been deemed a danger to themselves, others, or are a self-care failure. Without this program, the citizens of Kansas would not have a safety net for the community and the individuals whom are served on PSP to provide treatment, community re-integration services, and programing focused on long term treatment needs. Program GoalsA. Assessment by medical staff completed within 24 hours of admission to determine treatment needs for the patients. B. Prepare patients for community re-integration and to manage their mental illness in a less restrictive community-based setting. C. Provide treatment and skills to reduce an individual's need for long term treatment and/or re-admission allowing them an opportunity for independent living. Performance Measures
Sexual Predator Treatment ProgramProgram HistoryThe Sexual Predator Treatment Program (SPTP) was established in 1994 and provides for the civil commitment of persons determined by a Court to be Sexually Violent Predators (residents) as defined by statute. The program provides treatment in a secure environment with the goal of educating the residents to identify and manage risk and to returning Residents to the community where they can function as contributing, productive citizens.
Consequences of Not Funding this ProgramTo not fund the SPTP program would be to violate K.S.A 59-29a the Sexually Violent Predator Statute as we could no longer house and treat the residents civilly committed here without funding for this program. Program GoalsA. To house and treat residents civilly committed as sexually violent predators to the LSH SPTP program. B. To provide a safe and secure environment for the treatment of sexually violent predators committed by the courts to SPTP. C. To provide effective treatment consistent with RNR model, in multi level programming designed to help residents progress to independent living while displaying safe behaviors through insight and relapse prevention planning. Performance Measures
Staff Ed & ResearchProgram HistoryStaff Education and Research areas of focus are to provide educational opportunities to assist LSH employees in enhancing competent performance through facilitating training opportunities for staff intended for the purpose of developing and maintaining professional performance as well as personal development.
Consequences of Not Funding this ProgramWithout the funding of this program, LSH would not be able to provide the necessary education to meet Joint Commission and CMS requirements. Consequently, staff would not have the necessary skills to provide a safe and secure environment for patient treatment needs. Program GoalsA. Provide Staff Education and Educational opportunities to staff. B. Ensure Staff are prepared for safe management of disruptive and assaultive Patient behavior. Performance Measures
State Security ProgramProgram HistoryThe State Security Program (SSP), originally opened March 27, 1939, to house the criminally insane, opened on the Dillon building, with the transfer of 100 patients from Lansing State Prison.
Consequences of Not Funding this ProgramReducing or eliminating district court beds in the State Security Program would result in a substantial impact for the criminal court system across Kansas as well as the Mental Health Centers and law enforcement agencies. Individuals with felony crimes would go unserved for competency restoration, evaluation, and care and treatment for increasingly longer periods of time. The pending admission list would increase for these individuals, resulting in longer wait times in county jails or inability to properly serve specific individuals with mental illness. Program GoalsA. To fulfill obligations to the District Courts of Kansas regarding forensic evaluations. B. To provide active treatment to patients ordered to the SSP. C. Maintain compliance with agency documentation policies. Performance Measures
Office of the Child AdvocateAdministrationProgram HistoryIn October 2021, Executive Order 21-27 and 21-28 created the Division of the Child Advocate within the Department of Administration's Office of Public Advocates. The Office of the Child Advocate was established as an independent agency with the passage of Senate Bill 115 in April 2024.
Program GoalsA. Kansans are aware of the role, work, and value of OCA. B. OCA investigations are conducted and reported in a timely fashion. C. OCA recommendations are tracked for implementation and evaluated for effectiveness. Performance Measures
Osawatomie State HospitalAAC AdministrationProgram HistoryThis program provides the overarching structure for the hospital and ensures that the activities necessary to manage the facility are completed, and that treatment standards are upheld to ensure that patients receive proper care and treatment, and that the hospital maintains accreditation. General Administration Program provides the overall administration and management of AAC. Included in General Administration is the CEO's office, the Chief Business Operations Director, performance improvement and risk management. All other administration programs are provided through the MOU. These include: accounting, accounts payable, billing and collections, budget, cashier and post office, contract management, credentialing, employee benefits, health information management, human resource management, patient accounts, patient canteen, purchasing, program assistants, information technology services, legal services, and recruitment.
Consequences of Not Funding this ProgramThe complexity and uniqueness of state hospitals requires professional support staff well trained and well versed in the standards required for continued operation of the facility. Not funding this program would lead to an increase in the utilization of Agency Staffing (where applicable) and a complete breakdown of day to day operations without proper insight on management requirements this program currently provides. Program GoalsA. Track percentage of employees that turnover in a month/year. B. Record number of filled and vacant positions in a month/year. C. The monthly Physical interventions rate will be below .30 per 1000 patient hours for all physical interventions. Performance Measures
AAC Clinical ProgramProgram HistoryThe Clinical Service Program provides most group and individual psychotherapy for the patients admitted at Adair Acute Care. Service is provided to licensed beds across five distinct treatment programs and therapuetic activities occur seven days a week, 365 days a year. Within each program, the care for the patient is individualized with coordination and oversight being provided by an interdisciplinary team of mental health professionals. The approach used in each program is drawn from evidence-based practices and is regularly reviewed to ensure it remains an accepted and effective standard of care. Clinical Services includes the activity therapies subprogram which provides patients with specialized clinical services in music, vocational, and recreational therapy, as well as more general leisure skills training consistent with their presenting psychiatric concerns.
Consequences of Not Funding this ProgramThis program is the frontline support for patients. This program in integral to the patients treatment plan, as well as, responsible for the day to day patient care and active treatment. The agency would have to discontinue services to all the counties it supports if this program were to be eliminated. Program GoalsA. 100% of patients who are readmitted within 30 days of discharge will be tracked to identify trends. B. A comprehensive discharge plan will be developed and implemented. 95% of patients will have discharge criteria that is Realistic, Attainable, and individualized to their treatment on their Master Treatment Plan with a Psychosocial Assessment being completed within 72 hours of admission. C. The Hospital Acquired Infection (HAI) infection rate at AAC will remain below the national average of 4%. Performance Measures
AAC Medical ProgramProgram HistoryAll psychiatric and medical services provided to the patients at Adair Acute Care at OSH (AAC) are done under the auspices of the Medical and Surgical Services Program. From the initial evaluation, through day-to-day care, and up to the point of discharge, the medical staff forms the backbone of the medical and medication management for the patients being treated at the hospital. Coverage is provided on a "24/7" basis so that a physicisan is always available to address the treatment needs of the patients. In addition, ancillary treatment is provided through medical services including the Medical laboratory, pharmacy, podiatry, physical therapy, and other contracted services as appropriate to meed the needs of the patient. The Osawatomie State Hospital Provides some Medical Services to AAC through a Memorandum of Understanding.
Consequences of Not Funding this ProgramWithout this program the hospital could not provide psychiatric or medical services of any kind. The staff related to this program are responsible for the continued care and practice standards use to treat patients on a day to day basis. The agency would have to discontinue services to all the counties it supports if this program were to be eliminated. Program GoalsA. At least 95% of patients discharged will have a discharge summary completed within 30 days of discharge. B. 100% of patients will have a complete history and physical within 24 hours of admission. Performance Measures
AAC Physical Plant and Central ServicesPerformance Measures
AAC SD&T ProgramProgram HistoryThis program provides high quality, competency-based training and educational opportunities that promote individual performance, facilitate personal growth, and enhance positive patient outcomes. Staff Development and Training Services are provided to Adair Acute Care through a Memorandum of Understanding. In 2020 OSH was selected as the pilot site for Mid-America Addition Technology Transfer Centter (ATTC) and Truman Medical Center's pilot program for Trauma Informed Care implementation. The hospital is halfway through a three year project moving towards being a trauma informed care organization.
Consequences of Not Funding this ProgramStaff Development and Training are responsible for initial training and orientation to the hospital as well as ongoing performance adequacy and knowledgee checks to ensure best care practices, competency, and knowledge of staff. They also provide opportunities of continuing education on units leading, to continued accreditation. A decrease in staffing education would result in unsafe conditions for both staff and patients. Without the stewardship of this program, staff retention would fall dramatically due to lack of orientation, understanding, accreditation of the individual, as well as, communication. Program GoalsA. 100% of new hires will complete orientation. Performance Measures
OSH AdministrationProgram HistoryThis program provides overarching structure for the hospital and ensures that the activities necessary to manage the facility are completed, that treatment standards are upheld to ensure patients receive proper cate and treatment, and that the hospital maintains accreditation. The General Administration Program provides overall administration and management of the Osawatomie State Hospital. This includes the Superintendents office, Chief Business Operations Director, performance improvement, risk management, accounts payable, billing and collections, budget, cashier and post office, contract management, credentialing, employee benefits, health information managment, human resource managment, patient accounts, patient canteen, purchasing, program assistants, information technology services, legal services, and recruitment. The Osawatomie State Hospital also provides administrative services to Adair Acute Care through a Memorandum of Understanding.
Consequences of Not Funding this ProgramThe complexity and uniqueness of state hospitals requires professional support staff well trained and well versed in the standards required for continued operation of the facility. Not funding this program would lead to an increase in the utilization of Agency Staffing (where applicable) and a complete breakdown of day to day operations without proper insight on management requirements that stem from this program. Program GoalsA. Track Percentage of Employees that turnover in a month. B. Track percentage of transmission submitted to Insurance/Medicare/Medicaid within 30 days of discharge. C. Track percentage of requests for Goods and Services on the OSH help Desk answered within 24 hours of submission, per month. Performance Measures
OSH Clinical ProgramProgram HistoryThis program provides most group and individual psychotherapy for the patients admitted. Services are provided across five distinct programs and therapeutic activities occure seven days a week 365 days a year. Within each treatment program, care for the patient is individualized according to the patients unique presenting concerns with coordination and oversight being provided by and interdisciplinary team of mental health professionals. The approach used in each program is drawn from evidence-based practices and ir regularly reviewed to ensure it remains an accepted and effective standard of care. This program includes activity therapies, vocation, and recreation therapy, as well as more general leisure skills training consistent with their presentingpsychiatric concerns.
Consequences of Not Funding this ProgramThis program is the frontline support for patients. This program in integral to the patients treatment plan, as well as, responsible for the day to day patient care and active treatment. The agency would have to discontinue services to all the counties it supports if this program were to be eliminated. Program GoalsA. Number of months the Hospital Associated Infection rate remains below national average of 4%. B. Track and trend percentage of discharged patient readmitted within 30 days. C. 95% of staff are in compliance with the 5 moments of handwashing. Performance Measures
OSH MedicalProgram HistoryAll psychiatric and medical services provided to the patients at Adair Acute Care at OSH (AAC) are done under the auspices of the Medical and Surgical Services Program. From the initial evaluation, through day-to-day care, and up to the point of discharge, the medical staff forms the backbone of the medical and medication management for the patients being treated at the hospital. Coverage is provided on a "24/7" basis so that a physicisan is always available to address the treatment needs of the patients. In addition, ancillary treatment is provided through medical services including the Medical laboratory, pharmacy, podiatry, physical therapy, and other contracted services as appropriate to meed the needs of the patient. The Osawatomie State Hospital Provides some Medical Services to AAC through a Memorandum of Understanding.
Consequences of Not Funding this ProgramWithout this program the hospital could not provide psychiatric or medical services of any kind. The staff related to this program are responsible for the continued care and practice standards use to treat patients on a day to day basis. The agency would have to discontinue services to all the counties it supports if this program were to be eliminated. Program GoalsA. At Least 95% of patients discharged will have a Discharge Summary Completed within 30 days of discharge. B. 100% of patients will be evaluated and the Psychiatric Evaluation documented within 24 hours of admission. C. 100% of patients will have a complete history and physical within 24 hours of admission. Performance Measures
OSH Physical Plant and Central ServicesPerformance Measures
OSH SD&T ProgramProgram HistoryThis program provides high quality, competency-based training and educational opportunities that promote individual performance, facilitate personal growth, and enhance positive patient outcomes. Staff Development and Training Services are provided to Adair Acute Care through a Memorandum of Understanding. In 2020 OSH was selected as the pilot site for Mid-America Addition Technology Transfer Centter (ATTC) and Truman Medical Center's pilot program for Trauma Informed Care implementation. The hospital is halfway through a three year project moving towards being a trauma informed care organization.
Consequences of Not Funding this ProgramStaff Development and Training are responsible for initial training and orientation to the hospital as well as ongoing performance adequacy and knowledgee checks to ensure best care practices, competency, and knowledge of staff. They also provide opportunities of continuing education on units leading, to continued accreditation. A decrease in staffing education would result in unsafe conditions for both staff and patients. Without the stewardship of this program, staff retention would fall dramatically due to lack of orientation, understanding, accreditation of the individual, as well as, communication. Program GoalsA. 100% of new hires will complete orientation. Performance Measures
Parsons State Hospital & Training CenterAdministrationProgram HistoryThis program provides an administrative structure for the people residing at PSH&TC that enables the Superintendent and PSH&TC's Department Managers to aachieve maximum effectiveness and efficiency in PSH&TC's operation. PSH&TC's operation is directed towards implementing supports and services for persons with intellectual and developmental disabilities and at meeting the requirements of rules, regulations, policies, and standards of relevant state and federal agencies.
Consequences of Not Funding this ProgramPSH&TC would have to close. Approximately 150 individuals with intellectual and developmental disabilities would have to be relocated to other living situations. Many of these individuals are dually diagnosed with extreme behavior issues that could create violent and unexpected consequences for the public. This would place a unpredictable burden on the local community who would have to assume responsibility for these individuals, their mental, medical and physical needs. Additionally, Sexual Predator Treatment Program participants would have to be returned to the Department of Corrections and their transition to society plans cancelled. They would be transferred back into incarceration instead of being able to fulfill their quest to re-gain their freedom. Finally, 490.2 FTE positions and 35-40 temorary employee positions would be eliminated, causing extreme unemployment issues in the small rural community of Parsons, KS. Program GoalsA. Effectively administer and oversee the PSH&TC programs that provide effective habilitation, rehabilitation, active treatment and care to residents of the facility in a safe, healthy and home like living environment with consideration for the informed personal lifestyle choices of each resident. B. Provide budgetary oversite and manage resources within budgetary authority accounting for all expenditures for supplies, equipment and personnel according to State of Kansas statutes, rules and regulations, as well as maintaining compliance with regulatory and certification agency requirements (CMS, ICF/IID, KDHE, SSA, etc.). C. Recruit personnel and manage payroll and fringe benefit programs. D. Provide information technology services and communications services throughout the facility. Performance Measures
Agency WideProgram HistoryAGENCY MISSION: To improve lives by connecting people with supports and services.
Consequences of Not Funding this ProgramPSH&TC would have to close. Approximately 150 individuals with intellectual and developmental disabilities would have to be relocated to other living situations. Many of these individuals are dually diagnosed with extreme behavior issues that could create violent and unexpected consequences for the public. This would place a unpredictable burden on the local community who would have to assume responsibility for these individuals, their mental, medical and physical needs. Additionally, Sexual Predator Treatment Program participants would have to be returned to the Department of Corrections and their transition to society plans cancelled. They would be transferred back into incarceration instead of being able to fulfill their quest to re-gain their freedom. Finally, 490.2 FTE positions and 35-40 temorary employee positions would be eliminated, causing extreme unemployment issues in the small rural community of Parsons, KS. Program GoalsA. Maintain compliance and certification as required to operate an Intermediate Care Facility for Individuals with Intellectual and Developmental Disabilities (ICF/IID), according to sate and federal regulations, under Title XIX of the Social Security Act. B. Provide effective habilitation, rehabilitation, active treatment and care to ICF/IID residents of the facility in a safe, healthy and homelike living environment with consideration for the informed personal lifestyle choices of each resident. C. Provide a transition program designed to safely reintegrate Sexual Predator Treatment Program participants into the community as productive members of society, with the intent that they can become independent and live offense free. Performance Measures
Ancillary ServicesProgram HistoryAncillary Services provides for a variety of resident needs such as vocational work programs, entertainment, education, and religious services, as well as overall physical and mental health and well-being. The focus is primarily individual resident needs and provides opportunities for a wide variety of social experiences where residents can interact with co-workers, friends, relatives and staff in group settings if they so desire. Each resident is offered a variety of choices for leisure time and social activities, religious services, and work programs. Disciplines of recreation, music, art and therapy based on personal preferences are included. Leisure activities for every resident are coordinated by Activity Specialists and include both individualized and personal outings as well as group outings. These activities explore the interests of everyone to better prepare the resident for vocational placement. Vocational work programs on campus help residents develop work skills. Every 30 days, programs are reviewed and adjusted as needed to ensure each individual's lifestyle needs are met.
Consequences of Not Funding this ProgramPSH&TC would have to close. Approximately 150 individuals with intellectual and developmental disabilities would have to be relocated to other living situations. Many of these individuals are dually diagnosed with extreme behavior issues that could create violent and unexpected consequences for the public. This would place a unpredictable burden on the local community who would have to assume responsibility for these individuals, their mental, medical and physical needs. Program GoalsA. Provide for the optimal mental, physical and social health of each resident with consideration for the informed personal lifestyle choices of each resident. Performance Measures
Habilitation and TreatmentProgram HistoryThere are currently 148 people with intellectual disabilities and dual diagnosis receiving services at PSH&TC. They live in nine different residential cottages located on PSH&TC's campus, 13-20 individuals per cottage. The cottages serve as the base from which all services to the individuals with intellectual disabilities living at PSH&TC are rendered. Services are provided 24 hours a day, 7 days per week. The primary goal of the Habilitation and Treatment program is to enable the people who live at PSH&TC to make choices based on their own personal preferences for all aspects of their lives.
Consequences of Not Funding this ProgramPSH&TC would have to close. Approximately 150 individuals with intellectual and developmental disabilities would have to be relocated to other living situations. Many of these individuals are dually diagnosed with extreme behavior issues that could create violent and unexpected consequences for the public. This would place a unpredictable burden on the local community who would have to assume responsibility for these individuals, their mental, medical and physical needs. Program GoalsA. Provide effective habilitation, rehabilitation, active treatment and care to residents of the facility in a safe, healthy, and homelike living environment with consideration for the informed personal lifestyle choices of each resident. B. Supplement and extend development of community service provisions for developmentally disabled children and adults through Outreach Services, a statewide program for persons with developmental disabilities and psychiatric impairments. Performance Measures
Medical and Surgical ServicesProgram HistoryMedical & Surgical Services strive to ensure optimal physical health of each resident and provides medical and nursing care for each resident including those with acute and chronic medical conditions. Diagnostic tests play an essential part in this process. Outside consultations from community providers are requested as needed. Additional services include the coordination of any necessary major medical needs and/or treatments for residents through specialized providers outside PSH&TC. Outside provider costs are normally covered by Medicaid under the Title XIX program and are billed by the entity providing the service.
Consequences of Not Funding this ProgramPSH&TC would have to close. Approximately 150 individuals with intellectual and developmental disabilities would have to be relocated to other living situations. Many of these individuals are dually diagnosed with extreme behavior issues that could create violent and unexpected consequences for the public. This would place a unpredictable burden on the local community who would have to assume responsibility for these individuals, their mental, medical and physical needs. Program GoalsA. Provide for the optimal mental and physical health of each resident with consideration for the informed personal lifestyle choices of each resident. Performance Measures
Physical Plant and Central ServicesProgram HistoryPhysical Plant & Central Services is responsible for the overall maintenance, safety and security of PSH&TC. Costs for utilities such as natural gas, electricity, water and sanitation services fall within this overhead program.
Consequences of Not Funding this ProgramPhysical Plant and Central Services includes the agency utilities and indirect care services that support the living environment of PSH&TC's residents. If this program is not funded an unsafe living environment results. ICF/IID certifications and licensure as a state hospital would be forfieted. PSH&TC would not be able to continue serving the people who have been placed at the facility for care and treatment. The facility would have to be closed, residents would be without homes and staff would be without income. Program GoalsA. To provide for a safe, secure and sanitary living and work environment for the residents and staff of PSH&TC while meeting compliance with all state and federal regulations pertaining to the program. B. To provide nutrition programs to meet the dietary needs of all PSH&TC residents. C. To provide clean living environments and provide laundry services for the people who live at PSH&TC. D. To provide safe and secure transportation for residents and staff. Performance Measures
Sexual Predator Treatment ProgramProgram HistoryHISTORY: The Sexual Predator Treatment Program (SPTP) serves individuals who have successfully progressed through the residential treatment portion of the Kansas Sexual Predator Treatment Program at Larned State Hospital and have received approval to move to the PSH&TC reintegration facility. SPTP serves upto 16 individuals in two reintegration facilities (Maple House and Willow House). It is expected that residents will spend an average of 4.7 years at the PSH&TC reintegration facility, depending on their compliance with treatment, therapy, and program rules.
Consequences of Not Funding this ProgramThis program provides a variety of supports to individuals who are transitioning from a Department of Corrections facility into a community setting. Not funding this program would result in these individuals being transferred back into a correctional facility and their transition programs would be cancelled. Any progress that they had made towards becoming productive members of society would be forfeited. The program would be shut down and the staff would lose their jobs and family income. Program GoalsA. To safely reintegrate residents into the community as productive members of society and to be independent and live offense free. B. Residents will utilize resources, transportation, and coaching to aid in obtaining employment. C. Residents will utilize program resources and complete program requirements to achieve transitional release. Performance Measures
Staff Ed & ResearchProgram HistoryThis program was restructured in FY 2022. The new structure provides a better system for tracking the progress of new staff throughout the training process. All staff are required to complete their training prior to reporting to their assigned areas of work. The new training format consists of a 2-day basic orientation for all new employees, followed by an additional 3-week New Employee Orientation (NEO) for all direct care staff. NEO is a series of classes focusing on specialized training designed to educate and train staff in detail regarding the delivery of supports and service, as well as rights and safety for individuals with intellectual and developmental disabilities.
Consequences of Not Funding this ProgramThis program provides basic and advanced training for PSH&TC staff. The people who live at PSH&TC require staff who are trained to deal with their special needs. If staff does not receive the specialized training necessary for supporting individuals with intellectual and developmental disabilities, an unsafe living environment with increased risk of injury to individuals and staff results, compliance with ICF/IID regulations would be jepoardized and PSH&TC's certification and license as a special ICF/IID state hospital would be rescended. Without proper certification and license PSH&TC would be forced to close. Program GoalsA. Provide staff training and a full range of staff development services to all PSH&TC personnel and promoting research that will contribute to higher quality service and living environments for people with intellectual and developmental disabilities. Performance Measures
PUBLIC SAFETYPUBLIC SAFETYAdjutant GeneralAir Guard FacilitiesProgram HistoryThis agreement is a contract between the State of Kansas and the United States government for the operation and maintenance of US Government facilities licensed for use by the State of Kansas. This agreement is written pursuant to Public Law 95-224, Office of Management and Budget (OMB) Circular A-104 and approved by the Adjutant General pursuant to authorities prescribed in KSA 48-204 A.D. Title 32 USC
Consequences of Not Funding this ProgramSignificant risk is associated with a lack of state funding for Air Guard facilities sustainment and modernization to support State and Federal missions. State funds equals federal financial support and without it Kansas communities will witness an economic impact and degraded emergency response. Program GoalsA. Provide a trained, professional force ready to serve Community, State and Nation. B. Provide sustainment, repair, and maintenance for Air National Guard licensed facilities. C. Operate facilities economically, efficiently, and timely to be good stewards of state funding. Performance Measures
Army Guard FacilitiesProgram HistoryFunding supports activities associated with the maintenance of Army National Guard (ARNG) buildings and grounds through sustainment, restoration, and modernization. These efforts are essential to providing community based installations and training sites that by virtue of their geographical dispersion can be leveraged by the Army and the State; and that facilitate communications, operations, training, and equipment sustainment to support the deployment of required forces for assigned State and Federal missions.
Consequences of Not Funding this ProgramReduced or eliminated state funding would result in significantly increased risk for Army facilities. Kansas ARNG facilities are currently rated as "poor" in multiple areas and without acceptable funding levels from the state, we cannot sustain and modernize these facilities in order to support training Soldiers for State and Federal missions. If the condition of our facilities falls below acceptable levels there is risk of losing the units associated with those facilities. The loss of those units would result in the loss of the capabilities they possess for our state during an emergency and a loss of economic impact to our Kansas communities. Additionally, increased state investment in facility maintenance provides additional leverage when pursuing accompanying federal resources." Program GoalsA. Fund and support 84 Readiness Centers & other Federal buildings and ground maintenance across the State (1,376,723 sq ft). B. Fund and support 103 Training Site Facilities across the State (753,842 sq ft). C. Fund and support 28 Logistical Facilities across the State (283,170 sq ft). Performance Measures
Civil Air Patrol
Consequences of Not Funding this ProgramEmergency and other services provided by the Civil Air Patrol (CAP), such as search and rescue and disaster relief, would be cost prohibitive if the State were required to purchase the services. The State would have to either pay the CAP or contract those duties that the CAP currently provides. Program GoalsA. The Adjutant General's Department simply administers the program. Comptroller
Consequences of Not Funding this ProgramWith reduced or eliminated funding, the agency would incur late fees, loss of credibility from suppliers, missed state and federal deadlines, reduction of turnaround time on reimbursement from the federal government, reduced staff morale, inability to properly follow procurement and travel rules, inability to pay State Active Duty in a timely manner, loss of inventory control and increased deficiency findings from state and federal audits. Program GoalsA. Total number of repeat audit findings on the Schedule of Expenditures of Federal Awards (SEFA). B. Total amount of late fees paid annually. Performance Measures
Crisis City Training & Exercise FacilityProgram HistoryThe facility opened in October 1, 2009 and provides a state-of-the-art training and exercise facility for first responders, the private sector, military civil support, and emergency managers to apply learning in a practical environment.
Consequences of Not Funding this ProgramOperations at Crisis City will be curtailed or stopped, leaving large parts of the training venue unusable. This will result in a degradation of Kansas first responder skills, and an increase in local, county, and state agency costs by forcing them to pursue this training outside the state of Kansas. Program GoalsA. Ensure maintenance of venues and utilities are in working order. Performance Measures
Disaster Recovery Payments
Consequences of Not Funding this ProgramEligible applicants at the local, state, and Indian Tribes will not receive pass through funds for federally declared disasters, which is a violation of the Federal/State Agreement. These funds are associated with eligible reimbursements for disasters. Program GoalsA. Provide reimbursement to eligible applicants as a result of a federal disaster declaration. Performance Measures
Emergency CommunicationsProgram HistoryThe function of emergency communication was established in 2007 due to the Governor's Executive Order establishing Interoperability in Kansas. One personnel reported to the Adjutant General and the Kansas Department of Transportation provided personnel and two deployable Communication on Wheels (COW) to support the state's 800 MhZ radio system. Later, the Office of Emergency Communications was established within the military division of the Adjutant General's Department and the personnel and equipment from KDOT was transferred to this office. In 2017, the Office was transferred to KDEM and is located within the Response & Recovery Bureau.
Consequences of Not Funding this ProgramThis section is vital to public safety communications for the state. It functions as the sole focal point for coordinated efforts to ensure effective and available communications in disasters as well as daily public safety operations. Due to its small size, any appreciable reduction in funding could result in complete elimination of functions essential to the statewide application of public safety communications. Program GoalsA. Maintain readiness to provide statewide interoperable communications. Performance Measures
Federally Declared DisastersProgram HistoryRobert T. Stafford Disaster Relief and Emergency Assistance Act, PL 100-707, signed into law November 23, 1988; amended the Disaster Relief Act of 1974, PL 93-288.
Consequences of Not Funding this ProgramWithout federal disaster funding, all response and recovery mission costs will fall onto the state and local levels. This will place a massive cost burden on those affected. Currently when a disaster is federally declared the state must provide 25% and the federal government provides 75%. Of the state's 25% share, 15% is paid by the applicant and 10% is paid with state funds (SGF or State Emergency Funds). The state must commit 25% or the federal share will not be available and provided. Performance Measures
Human Resources
Consequences of Not Funding this ProgramEmployees will not have direct access to information and technical support for benefits and payroll. There would be no structure for the implementation and administration of agency policies and procedures that ensure the fair and equitable treatment of employees as required by state and federal laws, statutes, regulations and practices. The agency will be vulnerable to equal employment opportunity (EEO) claims and employment lawsuits. Program GoalsA. 100% of employees received New Employee Orientation (NEO) including enrollment in State Benefits for which they are eligible within two weeks of start date. B. Percentage of employees that received a performance review annually. Performance Measures
Information Technology
Consequences of Not Funding this ProgramThe Adjutant General's Department does not receive IT support from the Kansas Office of Information Technology Services (OITS). State employees/functions within the department receive IT support from the National Guard (NG) under a memorandum of agreement (MOA) at nominal cost to the state. Reducting the funding used for this purpose would result in the inability to pay for IT support from the NG. Thus the agency would have to secure IT support through other means, which would result in significantly increased costs to the state. Program GoalsA. Percentage of uptime for all prescribed services. B. Percentage of all Help Desk tickets responded to within 1 business day. C. Percentage of all requests for application and/or IT project development reviewed and evaluated and clearly approved or rejected within 28 working days. D. Percentage of all approved projects completed within established time and cost parameters. E. Percentage of customer service feedback is rated "Positive." Kansas Division of Emergency ManagementProgram HistoryThe Division was established in 1941 as the State Council of Defense and evolved to all an all-hazard program in 1974. KDEM was created under the revised statutes of KSA Chapter 48, Article 9, (Kansas Emergency Preparedness for Disasters Act); and KSA Chapter 65, Article 57, (Kansas Emergency Planning and Community Right to Know Act).
Consequences of Not Funding this ProgramA reduction in funding would greatly reduce the ability for the State of Kansas to prepare, respond, and recover from natural or unnatural disasters. It is necessary to have state funds in order to receive federal funds. Without State funds these programs would not be able to support their statuary requirements. The inability to serve our state in times of need would be evident during a disaster. Lack of funds to adequately prepare for, respond to, and recover from any disaster could be devastating to our state. Program GoalsA. Strengthen the State of Kansas' ability to prevent, protect, respond to, and recover from all hazards. B. Funding provides for KDEM personnel and administrative costs associated with planning, mitigation, response, recovery, training, and exercises. C. Enhance statewide preparedness capabilities through collaboration and partnerships. Performance Measures
Kansas Intelligence Fusion CenterProgram HistorySince 2012, KIFC has aggressively sought to search, process, and exploit classified information from national intelligence networks, databases and message handling systems that support Kansas specific HLS intelligence analysis while building trusted partnerships with federal homeland security, intelligence community and law enforcement (LE) agencies to improve KIFC's ability to access threat information impacting Kansas. Gather local and state level threat events and suspicious activity reporting (SAR) for early detection of homeland security threats and for correlation with national level intelligence to develop analysis of persistent threats and long term trends, while protecting the civil liberties and privacy of Kansas citizens. Conduct rigorous intelligence analysis to support Kansas specific homeland security decision making needs at both the strategic and tactical levels. Develop networks of state and local homeland security, public safety, law enforcement and critical infrastructure partners to maximize dissemination of threat reporting and risk assessments and to collect continual feedback for regular reassessment of Kansas intelligence needs.
Consequences of Not Funding this ProgramReduced funding would result in fewer analysts, which would dramatically reduce the awareness of the threats to Kansas, its citizens, governmental institutions, critical infrastructure, key resources and private sector businesses and industry. This will result in increased risk and reduced ability to prevent or mitigate the effects of naturally-occurring events like emerging diseases or purposeful acts, such as terrorism. Program GoalsA. Create high-value all-source intelligence products to protect life, freedoms, and property of the people of Kansas. KIFC is focused on the three primary Kansas Homeland Security (HLS) risk areas. B. Terrorism threats, asymmetric warfare threats, and transnational criminal organization (TCO) threats. C. Biological threats (both manmade and natural pathogens threatening human health, animal health, and plant/crop health). D. Cyber-warfare threats and threats to Critical Infrastructure/Key Resources (CIKR). Performance Measures
Office of the Adjutant General
Consequences of Not Funding this ProgramWithout adequate funding, the Adjutant General would cease to have the essential administrative support that is requried to coordinate and synchronize all efforts of the Adjutant General's Department. Program GoalsA. Military forces trained and prepared to respond to state and federal missions. B. Prepare the state to provide effective and coordinated response and recovery to natural and manmade disasters, to include terrorism. Performance Measures
Public AffairsProgram HistoryThe Kansas Militia, was formed Aug. 30, 1855. In 1993, the Division of Emergency Preparedness was redesignated as the Division of Emergency Management.
Consequences of Not Funding this ProgramThe public will not be informed or updated on emergencies or disasters, which would have an impact on the Governor's ability to effectively respond to emergencies or disasters. Additionally, a lack of awareness of the activities of the Adjutant General's Department would have a negative impact on recruiting in the Kansas National Guard. The inability to meet recruiting requirements would put the State at risk to lose force structure and vital capabilities needed to respond to emergencies or disasters. Program GoalsA. Staff the Joint Information Center during emergencies that require activation of the State Emergency Operations Center to coordinate and disseminate messages with Emergency Support Function partners via the media and social media platforms. B. During educational campaigns (Severe Weather Awareness Week, Suicide Prevention Month, Read the Label Campaign, Sexual Assault Awareness, Kansas Preparedness Month, etc.) content is created and provided through various channels which include social media platforms, internal/external e-mails, and news releases to the media. C. Publication of agency (Kansas Division of Emergency Management and the Kansas Army and Air National Guard) news and stories to keep the stakeholders in our agency, communities and state engaged and informed on what is happening within the agency. Performance Measures
Radiological, Biological, and NuclearProgram HistoryTo meet requirements of the federal Nuclear Regulatory Commission (NRC), a Radiological Systems Management section was established in the 1970s. Responsibilities included inspection, repair, calibration, and exchange services for over 70,000 radiological detection, as well as identification and computation, instruments in Kansas. The construction of two nuclear power plants - the Wolf Creek Generating Station near Burlington, Kansas, and the Cooper Nuclear Station in southeast Nebraska - required increased planning activities to protect the public from a potential release of radioactive material into the environment. The Kansas Statute that governs this section is Chapter 48 Article 9 Section 40-48, which is the Kansas Nuclear Safety Emergency Management Act.
Consequences of Not Funding this ProgramReduced or eliminated funding would inhibit the state's ability to properly prepare and exercise for an event and the State would be in non-compliance with Kansas Regulations. Additionally, if the State does not plan and successfully pass an evaluated exercise, nuclear plants in the State can lose their license to operate. Program GoalsA. Provide outreach to ingestion pathway counties, update incident specific plan, and calibrate and distribute radiological equipment. Performance Measures
State Active DutyProgram HistoryState laws passed in 1885 created the Kansas National Guard from resources of the State Militia. As a joint State/Federal agency, the dual mission of the Kansas National Guard is mandated in Article 8, Constitution of Kansas and Article 1, Section 8, of the U.S. Constitution. A 1903 Congressional Act formalized Federal/State authorities in USC Titles 32, 10, and 5. KSA 48-209 authorizes the Governor to place retired members of the Kansas National Guard on State duty for short periods of time to fulfill essential public safety service to Kansas. KSA 48-253 provides authorities for the State to assist funding the KNG marksmanship programs. A major share is now federally funded including pay, travel, equipment and training.
Consequences of Not Funding this ProgramThe Kansas National Guard would be unable to perform the duties as ordered by the Governor in the event of an emergency. Performance Measures
State Declared Disaster Payments
Consequences of Not Funding this ProgramWithout funding there would be no coordination of resources, causing chaos and potentially more loss. The State Emergency Operations Center (SEOC) reduces those risks. During emergencies and disasters, the SEOC facility serves as the nerve center for federal, state, and local coordination, and is necessary to ensure continuity of operations and government in major disasters caused by any hazard. The cost burden of state-only is that there is no federal funding is available. Program GoalsA. Provide funds to supplement resources needed to respond to a governor's state of disaster declaration. Performance Measures
State Emergency Operations CenterProgram HistoryThe Division was established in 1941 as State Council of Defense evolving to an all-hazards program in 1974. KDEM was created under the revised statutes of Kansas, KSA Chapter 48, Article 9, (Kansas Emergency Preparedness for Disasters Act); and KSA Chapter 65, Article 57, (Kansas Emergency Planning and Community Right to Know Act).
Consequences of Not Funding this ProgramThe State Emergency Operations Center is the visual and operational hub to coordinate the state's response and recovery actions to support local governments. Care and upkeep is of the upmost importance. Without a properly maintained facility, the State's ability to respond to and recover from incidents would be greatly diminished Additionally, without the State Emergency Operations Center, the ability to coordinate efforts with other State and Federal agencies is eliminated. Program GoalsA. Sustain and enhance state operational readiness and response capabilities. Performance Measures
Comm. on Peace Officers Stand. & TrainingAdministrationProgram HistoryThis regulatory (and law enforcement agency) began operation in FY 2008 in Hutchinson, Kansas, where its one employee was provided a temporary office in the Kansas Law Enforcement Training Center. The KSCPOST agency currently has a permanent location in Wichita, Kansas with 6 FTE. The Commission consists of a 12-member body appointed by the governor.
Consequences of Not Funding this ProgramWithout funding, this program would fail to meet the statutory mandates of KSA 74-5607, KSA 74-5611, and KSA 74-5620. Kansas Statues dictate commission structure, function and the establishment of a central registry database for law enforcement officer training. The KSCPOST serves over 8300+ Kansas law enforcement officers. Program GoalsA. KSCPOST is committed to providing the citizens of Kansas with qualified, trained, ethical, competent, and professional peace officers. Performance Measures
Department of CorrectionsAdministrationProgram HistoryThe 1973 Penal Reform Act established the Department of Corrections and consolidated all penal institutions under the direction of the Secretary
Consequences of Not Funding this ProgramThe Administration program includes the activities of the Secretary of Corrections and other administrative and support personnel responsible for Program GoalsA. To provide the leadership, support, and oversight necessary for the correctional system to meets its objectives. B. To provide the administrative and staff services required for operation of the Department of Corrections Central Office. Performance Measures
Capital Improvements
Consequences of Not Funding this ProgramThe capital improvement program is used solely for budgeting and recording expenditures related to rehabilitation and repair projects as well as new construction and renovation projects. Funds are transferred to the facility as projects are approved. Larger projects are managed at the KDOC Central Office and expenditures are recorded in this program. Eliminating this program would prohibit the Department from making repairs, upgrades, and improvements to the facilities. Program GoalsA. None; this program is for budgetary and accounting purposes only. Community & Field ServicesProgram HistoryParole services was established in the 1973 Penal Reform Act, which established the Department of Corrections. The act requires the Secretary to
Consequences of Not Funding this ProgramThe Community & Field Services Division is responsible for community-based supervision of offenders who have been released from correctional Program GoalsA. Provide offender supervision commensurate with the assessed risk level. B. Enhance public safety by increasing offender pro-social behavior. Performance Measures
Community CorrectionsProgram HistoryThe Community Corrections Act of 1979 authorizes the development and implementation of correctional programs, services and sanctions that are
Consequences of Not Funding this ProgramThe Community Corrections program provides funding for county-operated community corrections programs, to include probation supervision, the Program GoalsA. To increase the successful completion rate by 3% annually until a 75% successful completion rate has been achieved and maintained. B. Promote probationer accountability and responsibility to the community and to their victims. Performance Measures
Debt Service
Consequences of Not Funding this ProgramThis program was established solely for the purpose of recording interest and principle payments for separate from the operating budget. Evasions, Apprehensions, and InvestigationsProgram HistoryEAI had previously been incorporated in the Community & Field Services program. This program was separated from Community & Field Services
Consequences of Not Funding this ProgramEnforcements, Apprehensions, & Investigations (EAI) is responsible for conducting investigations, apprehending parole absconders and escapees, Program GoalsA. Provide the leadership, support, and oversight necessary for safe operation of the correctional facilities. Facilities ManagementProgram HistoryThe functions contained in the Facilities Management program were previously included in the Administration program. These functions were established as a separate program in 2018. Starting in FY 2021, food service contract expenditures were moved out of this program and into the food service program.
Consequences of Not Funding this ProgramThis program provides oversight of the adult correctional facilities, reviews and responds to resident grievances, conducts security audits and training, manages the resident security classification process and determines housing assignments, calculates sentences, manages the five-year capital improvements plan, and responds to constituent inquiries. Also included in this program are lease payments for the Lansing Correctional Facility. Elimination of funding would remove the leadership and centralized functions necessary to operate the Kansas correctional system. Program GoalsA. Provide appetizing meals to the inmate population which meets nutritional and daily caloric intake requirements as well as special diets necessary to meet individual medical and religious needs. Performance Measures
Food Service
Consequences of Not Funding this ProgramThis program was established to track food service contract expenditures separate from the Facilities Management program. Eliminating this program would eliminate funding required to feed the resident population. Program GoalsA. Provide for the delivery of appropriate medical care services in accordance with accreditation requirements of NCCHC, ACA, and within the clinical guidelines of AAFP and Medicaid. B. Provide for the delivery of appropriate dental care services in accordance with accreditation requirements of NCCHC and ACA. Care is also provided within the clinical guidelines of American Dental Association rules and regulations as well as Medicaid rules on dental services. Performance Measures
Health CareProgram HistoryThe Penal Reform Act of 1973 specifically established requirement that the Department employ a chief physician at each correctional facility to direct the operation and management of medical services and to supervise and coordinate the care of residents within the correctional facility. Health care services were privatized in 1988 when the Department awarded a contract for comprehensive medical and mental health services to Correctional Medical Systems, Inc. The contract was rebid in 1991 and awarded to Prison Health Solutions (PHS). PHS held the contract until October 2003, when the contract was assigned to Correct Care Solutions (CCS) after it was determined PHS was unable to meet the terms of the contract. CCS was awarded the contract following a rebid in 2005. In 2013, the Juvenile Justice Authority (JJA) was abolished and the functions and duties of JJA were transferred to KDOC. The contract was put back out for competitive bid later that year and health care services at the juvenile correctional facilities were incorporated into the request for proposals. The contract was ultimately awarded to Corizon, who took over health care services at all adult and juvenile facilities on January 1, 2014. The contract was put back out to bid in 2019 and as a result of the competitive bid process, the contract was awarded to Centurion effective July 1, 2020. Starting in 1995, KDOC began contracting for clinical oversight and compliance monitoring. This contract is currently held by the University of Kansas Medical Center.
Consequences of Not Funding this ProgramThe United States Supreme Court, in Estelle vs. Gamble (429 US 97), ruled that a prison inmate has the right, under the Eighth Amendment's prohibition of cruel and unusual punishment, to expect that he or she will receive health care of a quality and quantity that is not deliberately indifferent to the inmate's medical needs. Program GoalsA. Provide for the delivery of appropriate medical care services in accordance with accreditation requirements of NCCHC, ACA, and within the clinical guidelines of AAFP and Medicaid. B. Provide for the delivery of appropriate dental care services in accordance with accreditation requirements of NCCHC and ACA. Care is also provided within the clinical guidelines of American Dental Association rules and regulations as well as Medicaid rules on dental services. Performance Measures
Information TechnologyProgram Historystarting in FY 2018 to separate costs associated with EAI activities separate from parole services. EAI was originally established to provide a
Consequences of Not Funding this ProgramThe Information Technology program is responsible for planning, operation, and support of all information technology functions including Performance Measures
Juvenile ServicesProgram HistoryThe Juvenile Justice Reform Act of 1996 consolidated juvenile justice functions that had previously been housed in the Department of Social & Rehabilitative Services, the Judicial Branch, and the Department of Corrections into the Juvenile Justice Authority (JJA). Specific duties and responsibilities of JJA included the operation of the juvenile correctional facilities, evaluation of the effectiveness of juvenile offender rehabilitation efforts, contracting with out-of-home placement providers, providing operating grants, technical assistance, and oversight to community-based juvenile justice agencies, establishing and utilizing a diagnostic evaluation for all juvenile offenders, and monitoring placement trends and minority confinement. In 1998 legislation was passed that provided district court judges more discretion in determining the system under which a dually adjudicated youth would be handled--either as a child in need of care or as a juvenile offender. Legislation passed during the 1999 Session mandated the use of a sentencing placement matrix when a youth is sentenced to a term of incarceration in a juvenile correctional facility. The matrix went into effect on July 1, 1999 and granted authority the courts the authority to determine the length of incarceration in a juvenile correctional facility as well as the term of aftercare or conditional release supervision. Additionally, permanency hearings were implemented for juvenile offenders to reduce the amount of time juveniles spend in foster care by moving them toward a permanent family arrangement. The reforms brought about by the Juvenile Justice Reform Act resulted in a significant decline in the juvenile correctional facility population. This led the closure of facilities in Atchison and Beloit in 2008 and 2009, respectively. Executive Reorganization Order 42 abolished JJA and all duties and responsibilities of the agency were transferred to KDOC effective July 1, 2013. In 2016, the Legislature passed SB 367 which reinvests funds previously allocated for juvenile correctional facility and group home placements into evidence-based programs and practices designed to prevent further offending and youth going deeper into the criminal justice system. Shortly after the passage of SB 367, KDOC closed the Larned Juvenile Correctional Facility.
Consequences of Not Funding this ProgramExpenditures in this program are for Central Office staff who provide technical assistance, training, and oversight of the juvenile justice system in Kansas. Youth sentenced as juvenile offenders and supervised in the community are done so by community supervision officers funded through grants issued by KDOC to counties. Also funded through this grant process are intake and assessment centers, which are utilized by local law enforcement in suspected juvenile offender or child in need of care cases, and grant programs from the Evidence-Based Programs fund. Juvenile Services also contracts with a variety of residential and foster care providers for placement alternatives when staying at home is not in the best interest of youth or the family. Additionally, programs designed to provide youth and their families the resources and skills to address behavior and further escalation into the criminal justice system are provided through the Evidence-Based Programs fund as well other SGF and special revenue funds. Juvenile Services also oversees the Kansas Juvenile Correctional Complex. Elimination of this program eliminates all funding related to the supervision, treatment, and programming of juvenile offenders. Program GoalsA. Effective community-based juvenile justice programs are available to all Kansas youth and their families. Performance Measures
Offender ProgramsProgram HistoryThe Penal Reform Act of 1973 charged the Department of Corrections with providing rehabilitative services so residents may return to the community with "improved work habits, education, mental and physical health and attitudes necessary to become and remain useful and self-reliant citizens." Individual programs have been implemented over time as the needs of the population changes and research on effective programming continues to grow. Expenditures for 3rd time DUI treatment services were moved from the Community Corrections program to the Reentry & Offender Programs program in FY 2020.
Consequences of Not Funding this ProgramKDOC provides an array of recidivism reducing and reentry programs and services, including but not limited to, education, substance abuse Program GoalsA. Assess residents for risk and need, using validated instruments. B. Develop case plans with residents that target risk/need areas. C. Enroll residents in evidence-based cognitive-behavioral skills-building classes and programs (e.g., Thinking for a Change, Job Readiness, Improved. D. Increase successful program completions through readiness, responsivity, motivational enhancements, and providing programs in a dose that fits risk. E. Increase pro-social thinking through staff modeling, mentors, visits during incarceration and volunteer-led activities. F. Provide quality release planning services that addresses housing, connections to treatment, identification (driver's license), financial obligations, pending detainers (warrants/legal matters), family needs, and employment. G. Increase employability and employment opportunities for resident. H. Increase access to safe and affordable housing and tenant-ability of residents. I. Work closely with treatment providers to coordinate treatment with supervision and help residents remain connected to treatment (mental health, substance abuse). Performance Measures
Prisoner Review BoardProgram HistoryThe 1885 Legislature created the three-member Board of Pardons, whose responsibilities were to review pardon or commutation applications and report their recommendations to the Governor. In 1901 additional early release authority was granted to the Governor with the requirement that releases could only be granted if an adequate amount of time had been served, the inmate could be released without endangering the community, and the inmate could find suitable employment. Conditions of release would be applied, and the release could be revoked if those conditions were not met. In 1903 the Legislature created the Prison Board that consisted of the Board of Pardons and warden of the Kansas State Penitentiary. In 1957 the Prison Board was replaced with Board of Probation and Parole. This five-member panel was appointed by the Governor and confirmed by the Senate. Membership had to include an attorney, a minister, a businessman, and a farmer, and no more than three members could be of the same political party. The board was reduced to three members in 1961. By this time the Board had sole authority to grant or deny parole, while the Governor retained the power to grant pardons and commutations. The Board also had the responsibility of supervising those offenders placed on parole. The supervision requirement changed in 1974 when the Board was replaced with the Kansas Adult Authority and membership increased to five. The board members became full-time state employees in 1979, and in 1983 the board was reduced to three members. In 1986 the name was changed to the Kansas Parole Board. In 2011, Executive Reorganization Order 34 the Board was abolished and the duties and responsibilities of the Kansas Parole Board were transferred to the Prisoner Review Board within the Department of Corrections.
Consequences of Not Funding this ProgramFunctions outlined in statute currently performed by Prisoner Review Board would no longer be performed. This includes, but is not limited to, decisions pertaining to parole revocations, granting parole for off-grid crimes or revocation of post-release supervision, functional incapacitation releases, and review of clemency applications. Performance Measures
Victim Services
Consequences of Not Funding this ProgramStatute requires victim notification of offender status, to include release, escape, expiration of sentence, clemency application, and death, among others. Victim services also provides a liaison program, restorative justice programs, and batterer intervention programs. Loss of funding for victim services would prevent the Department from providing required notification services and result in the loss of federal funds for other victim programs. Program GoalsA. Serve as a liaison and service provider for crime victims. B. Provide quality, victim-centered batterer intervention program (BIP) services. Performance Measures
El Dorado Correctional FacilityAdministrationProgram HistoryAs a result of a 1988 class action lawsuit challenging prison conditions, former Governor Hayden recommended and the 1989 Legislature authorized the construction of the El Dorado Correctional Facility. The facility was originally built at a cost of $58 million dollars with a capacity of 640 offenders. In 1992, the honor camps at El Dorado and Toronto were merged with the Central Unit and renamed the El Dorado - North Unit and El Dorado - East Unit, respectively. A medium custody dormitory was then added to the Central Unit in 1995, creating an additional 115 beds. In 2001, two additional cell houses brought on-line and the reception and diagnostic unit was relocated from Topeka to El Dorado. In 2009, budgetary constraints led to the decision to close the North and East Units. To accommodate the continued growth in the resident population, the former conservation camp at Oswego was reopened in 2013 and designated as the El Dorado - Southeast Unit. During FY 2017, to better serve a growing mental health population, the mental health program at Larned was moved to El Dorado. The following year, the Individualized Reintegration Unit (IRU) was established, consisting of a single-cell housing unit were all services are provided at the unit, and double-cell housing unit where residents slowly reintegrate back into population by accessing services outside the unit. In 2021, U-dorm was temporarily closed as a result of a decline in the resident population and increase in vacancies.
Consequences of Not Funding this ProgramThe Administration program provides for the overall management and operational control of the facility. This program includes the warden, human resources, mailroom, policy and compliance, staff development, and fiscal. Not funding this program would eliminate the leadership and support functions necessary to operate the facility. Program GoalsA. Operate and maintain a personnel system in accordance with state and departmental regulations, ensuring that positions are classified appropriately and that vacant positions are filled in a timely manner. B. Operate programs for existing and new employees that provide the training required by state law and departmental regulations. Performance Measures
Capital Improvements
Consequences of Not Funding this ProgramThe capital improvement program is used solely for budgeting and recording expenditures related to rehabilitation and repair projects. KDOC central office is appropriated $4,920,000 from the Correctional Institutions Building Fund annually for rehabilitation and repair projects throughout the KDOC system. Funds are transferred to the facility as projects are approved. Eliminating this program would prohibit the Department from making repairs, upgrades, and improvements to the facilities. Classification & ProgramsProgram HistoryAs a result of a 1988 class action lawsuit challenging prison conditions, former Governor Hayden recommended and the 1989 Legislature authorized the construction of the El Dorado Correctional Facility. The facility was originally built at a cost of $58 million dollars with a capacity of 640 offenders. In 1992, the honor camps at El Dorado and Toronto were merged with the Central Unit and renamed the El Dorado - North Unit and El Dorado - East Unit, respectively. A medium custody dormitory was then added to the Central Unit in 1995, creating an additional 115 beds. In 2001, two additional cell houses brought on-line and the reception and diagnostic unit was relocated from Topeka to El Dorado. In 2009, budgetary constraints led to the decision to close the North and East Units. To accommodate the continued growth in the resident population, the former conservation camp at Oswego was reopened in 2013 and designated as the El Dorado - Southeast Unit. During FY 2017, to better serve a growing mental health population, the mental health program at Larned was moved to El Dorado. The following year, the Individualized Reintegration Unit (IRU) was established, consisting of a single-cell housing unit were all services are provided at the unit, and double-cell housing unit where residents slowly reintegrate back into population by accessing services outside the unit. In 2021, U-dorm was temporarily closed as a result of a decline in the resident population and increase in vacancies.
Consequences of Not Funding this ProgramThis program includes Classification and Records and various support functions. Classification and Records are responsible for the reporting and recording of all pertinent information regarding the movement and progress of residents at the facility, to included establishment of legal authority to incarcerate, movement, behavior, progress, disciplinary history, and program participation. Under the coordination of the unit teams, an individualized treatment program is developed, implemented, and maintained for each resident. Each resident, as well as facility staff, is kept aware of the resident's status within the correctional process. This program provides direct case management to the inmates, holding them accountable for their behavior, while identifying and localizing problems within each unit. Also include in this program are chaplain services, library services, and recreation. Not funding this program would eliminate the processes and activities that are critical to appropriate placement, documentation, and treatment plan development and implementation. Program GoalsA. To provide effective caseload management from reception to release of offenders from confinement. Performance Measures
SecurityProgram HistoryAs a result of a 1988 class action lawsuit challenging prison conditions, former Governor Hayden recommended and the 1989 Legislature authorized the construction of the El Dorado Correctional Facility. The facility was originally built at a cost of $58 million dollars with a capacity of 640 offenders. In 1992, the honor camps at El Dorado and Toronto were merged with the Central Unit and renamed the El Dorado - North Unit and El Dorado - East Unit, respectively. A medium custody dormitory was then added to the Central Unit in 1995, creating an additional 115 beds. In 2001, two additional cell houses brought on-line and the reception and diagnostic unit was relocated from Topeka to El Dorado. In 2009, budgetary constraints led to the decision to close the North and East Units. To accommodate the continued growth in the resident population, the former conservation camp at Oswego was reopened in 2013 and designated as the El Dorado - Southeast Unit. During FY 2017, to better serve a growing mental health population, the mental health program at Larned was moved to El Dorado. The following year, the Individualized Reintegration Unit (IRU) was established, consisting of a single-cell housing unit were all services are provided at the unit, and double-cell housing unit where residents slowly reintegrate back into population by accessing services outside the unit. In 2021, U-dorm was temporarily closed as a result of a decline in the resident population and increase in vacancies.
Consequences of Not Funding this ProgramThe Security program include salaries and wages for all uniformed security officers and operating expenses, such as clothing, drug testing, and security equipment. This program is essential to operating the facility. Program GoalsA. To maintain an effective posture of physical/perimeter security as measured by the KDOC Security Inspection and accreditation audits. B. To effectively control unsanctioned prison groups in the prison population through proper identification, tracking, intelligence gathering techniques, and management strategies. C. To maintain a safe environment for incarcerated offenders. Performance Measures
Southeast UnitProgram HistoryThe Southeast Unit was opened in January 2013, adding 262 medium and minimum security beds to the systemwide capacity. The unit was previously operated as a conservation camp separate from El Dorado and was closed in 2009 due to budgetary constraints.
Consequences of Not Funding this ProgramAll expenditures for the Southeast Unit, located in Oswego, are recorded separately from expenses related to the operation of the Central Unit. Included in this program are the salaries and wages for unit staff, the deputy warden, support staff, unit team, and maintenance staff, as well as utilities, clothing, and other operating expenditures. Not funding for this program would result it the unit's closure. Support ServicesProgram HistoryAs a result of a 1988 class action lawsuit challenging prison conditions, former Governor Hayden recommended and the 1989 Legislature authorized the construction of the El Dorado Correctional Facility. The facility was originally built at a cost of $58 million dollars with a capacity of 640 offenders. In 1992, the honor camps at El Dorado and Toronto were merged with the Central Unit and renamed the El Dorado - North Unit and El Dorado - East Unit, respectively. A medium custody dormitory was then added to the Central Unit in 1995, creating an additional 115 beds. In 2001, two additional cell houses brought on-line and the reception and diagnostic unit was relocated from Topeka to El Dorado. In 2009, budgetary constraints led to the decision to close the North and East Units. To accommodate the continued growth in the resident population, the former conservation camp at Oswego was reopened in 2013 and designated as the El Dorado - Southeast Unit. During FY 2017, to better serve a growing mental health population, the mental health program at Larned was moved to El Dorado. The following year, the Individualized Reintegration Unit (IRU) was established, consisting of a single-cell housing unit were all services are provided at the unit, and double-cell housing unit where residents slowly reintegrate back into population by accessing services outside the unit. In 2021, U-dorm was temporarily closed as a result of a decline in the resident population and increase in vacancies.
Consequences of Not Funding this ProgramFunctions included in this program consist of maintenance, laundry, warehouse operations. Also included in this program are utility expenditures. Not funding the support services program would eliminate funding necessary for the operation and maintenance of the facility. Ellsworth Correctional FacilityAdministrationProgram HistoryThe Ellsworth Correctional Facility (ECF) was established by KSA 75-52,122 in response to a rapidly increasing resident population and the need for additional bed space. Originally conceived as 96-bed minimum-security facility, the rapid population growth prompted a scope change in 1986 to add medium-security beds to the design. The facility received its first residents on August 8, 1988. In December 1995, forty-eight additional minimum-security beds were added to the minimum housing unit. Starting on February 14, 1994, ECF began housing all condition violators. The theory behind this change was that residents who have returned as technical violators were perceived to have needs that are somewhat different from the rest of the prison population, and rather than focusing on integrating this group into the prison system, the focus should be on reintegration back into the community. In December 1995, forty-eight additional minimum-security beds were added to the minimum housing unit and in January 1996, ECF assumed its original role of housing multi-custody level residents. The 2000 Legislature approved funding for the construction of a 100-bed maximum security housing unit at ECF. This was later changed to a 200-bed medium-security unit. This housing unit was constructed utilizing federal Violent Offender Incarceration/Truth in Sentencing funds with a 10% state match. Also included in this project was the construction of a new staff development building outside the secure perimeter of ECF, as well as expansion of the existing warehouse and construction of an industrial building inside the secure perimeter. Construction on this project began in November 2000 and all work was completed by November 2002. In July 2012, KDOC purchased the St. Francis Boy's Home for use as a minimum-security unit. Designated the ECF - East Unit, this unit provides 95 minimum-security beds. This purchase allowed ECF to move minimum custody residents outside the Central Unit, filling those minimum beds with medium custody residents previously housed in county jails. The East Unit was temporarily closed in 2021 due to the inability to hire enough staff to operate it.
Consequences of Not Funding this ProgramThe Administration program provides for the overall management and operational control of the facility. This program includes the warden, human resources, mailroom, policy and compliance, staff development, and fiscal. Not funding this program would eliminate the leadership and support functions necessary to operate the facility. Program GoalsA. Operate and maintain a personnel system in accordance with state and departmental regulations, ensuring that positions are classified appropriately and that vacant positions are filled in a timely manner. B. Operate programs for existing and new employees that provide the training required by state law and departmental regulations. Performance Measures
Capital Improvements
Consequences of Not Funding this ProgramThe capital improvement program is used solely for budgeting and recording expenditures related to rehabilitation and repair projects. KDOC central office is appropriated $4,920,000 from the Correctional Institutions Building Fund annually for rehabilitation and repair projects throughout the KDOC system. Funds are transferred to the facility as projects are approved. Eliminating this program would prohibit the Department from making repairs, upgrades, and improvements to the facilities. Classification & ProgramsProgram HistoryThe Ellsworth Correctional Facility (ECF) was established by KSA 75-52,122 in response to a rapidly increasing resident population and the need for additional bed space. Originally conceived as 96-bed minimum-security facility, the rapid population growth prompted a scope change in 1986 to add medium-security beds to the design. The facility received its first residents on August 8, 1988. In December 1995, forty-eight additional minimum-security beds were added to the minimum housing unit. Starting on February 14, 1994, ECF began housing all condition violators. The theory behind this change was that residents who have returned as technical violators were perceived to have needs that are somewhat different from the rest of the prison population, and rather than focusing on integrating this group into the prison system, the focus should be on reintegration back into the community. In December 1995, forty-eight additional minimum-security beds were added to the minimum housing unit and in January 1996, ECF assumed its original role of housing multi-custody level residents. The 2000 Legislature approved funding for the construction of a 100-bed maximum security housing unit at ECF. This was later changed to a 200-bed medium-security unit. This housing unit was constructed utilizing federal Violent Offender Incarceration/Truth in Sentencing funds with a 10% state match. Also included in this project was the construction of a new staff development building outside the secure perimeter of ECF, as well as expansion of the existing warehouse and construction of an industrial building inside the secure perimeter. Construction on this project began in November 2000 and all work was completed by November 2002. In July 2012, KDOC purchased the St. Francis Boy's Home for use as a minimum-security unit. Designated the ECF - East Unit, this unit provides 95 minimum-security beds. This purchase allowed ECF to move minimum custody residents outside the Central Unit, filling those minimum beds with medium custody residents previously housed in county jails. The East Unit was temporarily closed in 2021 due to the inability to hire enough staff to operate it.
Consequences of Not Funding this ProgramThis program includes Classification and Records and various support functions. Classification and Records are responsible for the reporting and recording of all pertinent information regarding the movement and progress of residents at the facility, to included establishment of legal authority to incarcerate, movement, behavior, progress, disciplinary history, and program participation. Under the coordination of the unit teams, an individualized treatment program is developed, implemented, and maintained for each resident. Each resident, as well as facility staff, is kept aware of the resident's status within the correctional process. This program provides direct case management to the inmates, holding them accountable for their behavior, while identifying and localizing problems within each unit. Also include in this program are chaplain services, library services, and recreation. Not funding this program would eliminate the processes and activities that are critical to appropriate placement, documentation, and treatment plan development and implementation. Program GoalsA. To provide effective caseload management from reception to release of offenders from confinement. Performance Measures
SecurityProgram HistoryThe Ellsworth Correctional Facility (ECF) was established by KSA 75-52,122 in response to a rapidly increasing resident population and the need for additional bed space. Originally conceived as 96-bed minimum-security facility, the rapid population growth prompted a scope change in 1986 to add medium-security beds to the design. The facility received its first residents on August 8, 1988. In December 1995, forty-eight additional minimum-security beds were added to the minimum housing unit. Starting on February 14, 1994, ECF began housing all condition violators. The theory behind this change was that residents who have returned as technical violators were perceived to have needs that are somewhat different from the rest of the prison population, and rather than focusing on integrating this group into the prison system, the focus should be on reintegration back into the community. In December 1995, forty-eight additional minimum-security beds were added to the minimum housing unit and in January 1996, ECF assumed its original role of housing multi-custody level residents. The 2000 Legislature approved funding for the construction of a 100-bed maximum security housing unit at ECF. This was later changed to a 200-bed medium-security unit. This housing unit was constructed utilizing federal Violent Offender Incarceration/Truth in Sentencing funds with a 10% state match. Also included in this project was the construction of a new staff development building outside the secure perimeter of ECF, as well as expansion of the existing warehouse and construction of an industrial building inside the secure perimeter. Construction on this project began in November 2000 and all work was completed by November 2002. In July 2012, KDOC purchased the St. Francis Boy's Home for use as a minimum-security unit. Designated the ECF - East Unit, this unit provides 95 minimum-security beds. This purchase allowed ECF to move minimum custody residents outside the Central Unit, filling those minimum beds with medium custody residents previously housed in county jails. The East Unit was temporarily closed in 2021 due to the inability to hire enough staff to operate it.
Consequences of Not Funding this ProgramThe Security program include salaries and wages for all uniformed security officers and operating expenses, such as clothing, drug testing, and security equipment. This program is essential to operating the facility. Program GoalsA. To maintain an effective posture of physical/perimeter security as measured by the KDOC Security Inspection and accreditation audits. B. To effectively control unsanctioned prison groups in the prison population through proper identification, tracking, intelligence gathering techniques, and management strategies. C. To maintain a safe environment for incarcerated offenders. Performance Measures
Support ServicesProgram HistoryThe Ellsworth Correctional Facility (ECF) was established by KSA 75-52,122 in response to a rapidly increasing resident population and the need for additional bed space. Originally conceived as 96-bed minimum-security facility, the rapid population growth prompted a scope change in 1986 to add medium-security beds to the design. The facility received its first residents on August 8, 1988. In December 1995, forty-eight additional minimum-security beds were added to the minimum housing unit. Starting on February 14, 1994, ECF began housing all condition violators. The theory behind this change was that residents who have returned as technical violators were perceived to have needs that are somewhat different from the rest of the prison population, and rather than focusing on integrating this group into the prison system, the focus should be on reintegration back into the community. In December 1995, forty-eight additional minimum-security beds were added to the minimum housing unit and in January 1996, ECF assumed its original role of housing multi-custody level residents. The 2000 Legislature approved funding for the construction of a 100-bed maximum security housing unit at ECF. This was later changed to a 200-bed medium-security unit. This housing unit was constructed utilizing federal Violent Offender Incarceration/Truth in Sentencing funds with a 10% state match. Also included in this project was the construction of a new staff development building outside the secure perimeter of ECF, as well as expansion of the existing warehouse and construction of an industrial building inside the secure perimeter. Construction on this project began in November 2000 and all work was completed by November 2002. In July 2012, KDOC purchased the St. Francis Boy's Home for use as a minimum-security unit. Designated the ECF - East Unit, this unit provides 95 minimum-security beds. This purchase allowed ECF to move minimum custody residents outside the Central Unit, filling those minimum beds with medium custody residents previously housed in county jails. The East Unit was temporarily closed in 2021 due to the inability to hire enough staff to operate it.
Consequences of Not Funding this ProgramFunctions included in this program consist of maintenance, laundry, warehouse operations. Also included in this program are utility expenditures. Not funding the support services program would eliminate funding necessary for the operation and maintenance of the facility. Emergency Medical Services BoardAdministrationProgram HistoryBeginning with the Bureau of Emergency Medical Services within the Kansas Department of Health and Environment (KDHE), and later, legislation transferred EMS operations to the Kansas Highway Patrol while EMS training remained within the University of Kansas Medical Center, the Kansas Board of Emergency Medical Services was established in 1988 by KSA 65-6102, and the current board assumed all powers, duties and functions concerning EMS. The 2004 Legislature established permanent funding for the Board of Emergency Medical Services with the passage of SB 312 which allows the Board .25% of Kansas Fire Insurance Premiums in the State of Kansas (KSA 75-1508). The 2006 Legislature, with the passage of SB 546, established the Kansas EMS Information System (KEMSIS). The intent of this system is to collect and analyze EMS information for assisting the Board in improving the quality of emergency medical services. The 2010 Legislature with the passage of SB 262 established a Medical Advisory Council for KBEMS and added two physicians to the Board. This will assist the Board as state ambulance services need assistance in the development of guidelines for their attendants. Additionally, SB 262 enhanced the treatment capabilities of EMS attendants by moving from authorized activities to a scope of practice. As a result, communities throughout Kansas will be afforded a higher level of pre-hospital care. The 2016 Legislature passed SB 225 incorporating the State of Kansas in the Interstate Compact for Recognition of Emergency Personnel Licensure. The Compact is being established to facilitate the day-to-day movement of EMS personnel across state boundaries in performance of their EMS duties. The Compact serves many purposes including increasing public access to EMS personnel, enhancing public safety, and supporting licensing of military members separating from active duty. The Legislature also amended KSA 65-6111 by passing SB 224 to enable the board to levy fines and issue subpoenas. The 2019 Legislature passed SB 53, which amended multiple statutes in completing four items: 1) Changed the term "attendant" to "emergency medical service provider"; 2) created an inactive certificate; 3) enabled the Board to perform a fingerprint based criminal history record check on new applicants; and 4) changed the minimum board meeting frequency from six meetings annually to four annually. The 2021 Legislature passed SB 238 which further strengthened medical direction in Kansas by clearing identifying the roles and responsibilities of the position of medical director and defined medical oversight. This Legislature also passed HB 2270 which made permanent what had been addressed historically as an annual proviso to the appropriations bill for the distribution of funding pursuant to KSA 75-4215 with 20% of those funds being distributed to the EMS Operating Fund.
Consequences of Not Funding this ProgramPublic safety in pre-hospital care is jeopardized when the competency of resources are not ensured prior to dispatch. Qualified attendants and services are not in place to respond to emergencies apppropriately. Substandard care from failure to adhere to evidence based medicine. Program GoalsA. To promote emergency medical services (EMS) through the consistent application of laws. B. To provide support for the ambulance services, EMS providers, and EMS educational organizations in maintaining statutory and regulatory compliance. C. To enhance patient care through evidence-based practice. Performance Measures
Highway PatrolAdministrationProgram HistoryThe Legislature officially organized the Kansas Highway Patrol in 1937. The Administration program represents universal administrative costs for common functions existing in the agency. These functions include the office of the Superintendent, Fiscal, Legal, Records, Professional Standards Unit, Information Technology, Public and Governmental Affairs, and Human Resources.
Consequences of Not Funding this ProgramThe services provided by these sub program units ensure the viability of the agency by administering strategic plans/directives of the Department of Administration, Executive Branch, as well as State and Federal laws. The agency as a whole would fail to meet statutorily required activities (74-2114, 74-2117, 74-2118), agency goals, and lack the leadership and support services necessary to carry out these critical functions of the agency. Program GoalsA. To improve the function, operation, and cohesiveness of KHP programs; maintain or improve the consistency of agency management and operations. Performance Measures
Aircraft OperationsProgram HistoryThe executive aircraft, and its debt, was transferred to the KHP from the Department of Administration in FY 2003. The superintendent is authorized to fix, charge and collect fees for aircraft services to other state agencies in order to recover all or part of the operating expenses of the aircraft program. The KHP Air Support program was created in FY 2018 for the aircraft fleet management, including the executive aircraft, as a result of the performance-based budgeting requirement. The Highway Patrol is the only statewide law enforcement agency that provides airborne service. The Patrol has aircraft based in Topeka, Wichita, and Hays. The agency maintains a Bell 407 helicopter, a fixed-wing Cessna 182 RG, and three fixed wing Cessna 206s. The helicopter and 2 of the 206s are equipped with forward Looking Infrared (FLIR), which allows pilots to see at night by sensing body heat, making it a valuable tool in searching for persons. Local, state and federal law enforcement agencies rely heavily on the Patrol's air assets. This program includes maintenance, fuel and parts costs and aircraft acquisitions. In FY 2007, a hangar was constructed at Billard Airport in Topeka to house the aircraft.
Consequences of Not Funding this ProgramIn FY2021, the Air Support Unit assisted 140+ Agencies (Local, State and Federal) with law enforcement and public safety aircraft support. The Air Support Unit participates in every public safety flight category including Vehicle Pursuits, COVID19 response, Surveillance, Patrol, Manhunts, Search, Red Cross Flights blood relay flights, Photo, Survey, Relay-Transport, in addition to Maintenance and Training Flights. The KHP Unit has flown a total of 847 hours and conducted over 375 missions or calls for service in the first 7 months of 2021. Should funding be eliminated from this program, these activities would be left for local law enforcement, or non-existent as the KHP is the only Law Enforcement agency in the state with air support. Program GoalsA. The KHP is the only statewide law enforcement agency that provides airborne services to local, state and federal agencies. In addition to the KHP aircraft fleet, the agency also manages the executive aircraft, which provides secure transportation services to the governor and other state agencies. Performance Measures
Capitol PoliceProgram HistoryThe Capitol Area Security Police was established by the Department of Administration in 1955 (KSA 75-403). 1975, the Kansas Highway Patrol assumed responsibility of Capital Area Security Patrol. Headquartered in Topeka, Troop K, now known as Capitol Police, functions as a full service law enforcement entity within the Kansas Highway Patrol in Shawnee County, Kansas. Employees with Troop K stay active in the Capitol Complex community by providing classes that promote safety and security. Law enforcement officers actively enforce criminal and traffic laws, expedite traffic flow around the Capitol and other state office buildings, investigate accidents, respond to and administer emergency medical assistance, and assist visiting citizens to the Capitol Complex. Law enforcement officers also provide interior police security at the Governor's residence, Kansas Judicial Center, Memorial Building, Kansas Insurance Building, and the State House. The Communication group within Troop K is responsible for radio and telephone communications for the Capitol Police
Consequences of Not Funding this ProgramWithout funding, this program would greatly reduce the visibility of law enforcement presence in the Capitol Complex buildings and availability of law enforcement support for the citizens of Kansas that visit or work in the complex. In addition, the responsibility of overseeing the security of the complex, as well as Cedar Crest, would be assumed by another agency or absorbed into an already strained staffing pool of KHP officers. Funding for the operations would need to be shifted to another agency or outsourced to a private entity. Program GoalsA. Provide for the pro-active safety of persons and the protection of property within the Capitol Complex and on other state-owned or state-leased property within Shawnee County. B. Decrease the damage and losses suffered by employees, and by the State, for property located within the Capitol Security's area of operation. C. Increase the pro-active safety of persons and property to include state parking lots located within the respective area of operations. Performance Measures
FleetProgram HistoryThe Kansas Legislature established the KHP Motor Vehicle Fund in 1994 through the passage of SB 212. Receipts to the fund are based on a $3.50 fee added to each title issued in Kansas and receipts from the sale of retired patrol vehicles.
Consequences of Not Funding this ProgramKHP operating expenditures would increase due to higher vehicle repair costs and lower gas mileage. Program GoalsA. To maintain a vehicle replacement program which will provide safer, better quality vehicles for the KHP and provide low mileage vehicles for sale to local law enforcement and other state and local agencies. Homeland SecurityProgram HistoryThere are no applicable Kansas statutes. DHS requires each state's governor to appoint an administrative agency, responsible for pass-through and oversight for this program. The KHP has served in that capacity since Federal Fiscal Year 1999. The Kansas Highway Patrol Homeland Security Office (HSO) has served as the Governor-appointed State Administrative Agency (SAA) for The Homeland Security Grant Program (HSGP) since 2001 and The Non-Profit Security Grant Program (NSGP) since 2018. The State of Kansas is divided into seven Homeland Security Regions with each represented by a governing council made up of local volunteers from various disciplines. As the SAA, the Patrol is responsible for pass-through and oversight of the HSGP and NSGP. The Homeland Security Grant Program provides funds to Kansas and its political subdivisions for improving the State's capability to prevent, protect, mitigate, respond, and recover from acts of terrorism and other catastrophic events. Funds from the Homeland Security Grant Program are provided to the State of Kansas from the U.S. Department of Homeland Security (DHS). The enabling federal legislation for FFY 2010 HSGP is The Department of Homeland Security Appropriations Act, 2010 (Public 111-83); the Implementing Recommendations of the 9/11 Commission Act of 2007 (Public Law 110-53) (hereafter "9/11 Act"); and the Homeland Security Act of 2002 (6 USC §101 et seq.).
Consequences of Not Funding this ProgramThe Homeland Security Grant Program provides funds to Kansas and its political subdivisions for improving the State's capability to prevent, protect, mitigate, respond, and recover from acts of terrorism and other catastrophic events. Funds from the Homeland Security Grant Program are provided to the State of Kansas from the U.S. Department of Homeland Security (DHS). The KHP is the subrecipient of these federal funds from DHS. Should funding be eliminated, the program would either be absorbed into the already strained resources of the agency, or redirected to another state/private entity which would greatly impact the integrity and effectiveness of the program and the ability to carry out the mission of the DHS. Program GoalsA. Support state, local, and tribal efforts to prevent terrorism and other catastrophic events, and to prepare the Nation for the threats and hazards that pose the greatest risk to the security of the United States. Performance Measures
Kansas Turnpike Authority (KTA)Program HistoryThe Patrol began policing the Kansas Turnpike in October 1956, with 13 officers and Troopers. Increasing traffic and mounting responsibilities necessitated an increase in the strength of the Turnpike Patrol to the present 52.5 Troopers, which is set and must be retained by agreement between the KHP and the Kansas Turnpike Authority (KTA). Additional Troopers were added to this program in FY 1998 (2), FY 1999 (1), FY 2000 (2), and FY 2012 (4) by transferring Troopers from the Highway Patrol Operations Program. Troopers assigned to the KTA unit receive the same stringent training as all KHP Troopers. Assignment is like the other units in that a Trooper may bid the position; or be assigned out of necessity by leadership. The KHP Turnpike Troop provides law enforcement and security to the Kansas Turnpike. This major artery is an exception to the general patrol operations in that it provides twenty-four-hour patrol coverage. Radio communications are continuously maintained, the same as all field Troop headquarters. The radio communications are staffed, operated by, and maintained by the Kansas Turnpike Authority. Troopers enforce traffic laws, render services to the motoring public, investigate accidents, provide emergency aid to injured persons, and develop cases pertaining to all criminal activity occurring on the Kansas Turnpike Authority property.
Consequences of Not Funding this ProgramThe Kansas Turnpike Authority (KTA) is the primary funding source for this program. By agreement, the Turnpike reimburses the Patrol for all expenditures. Should funding be eliminated, the program as it operates today would be greatly impacted in that the responsibilities and expenses would be absorbed into the agency's operations fund and additional appropriations needed. If a secure funding source is not identified, the policing of the Turnpike would be redirected to another agency or shifted to already strained resources of local law enforcement organizations in Kansas. Program GoalsA. Reduce fatality and serious injury accidents occurring on the Kansas Turnpike. B. Enhance the safety of persons traveling on Kansas roads by removing the criminal element from the Kansas Turnpike. C. Service motorists needing assistance on the Kansas Turnpike. Performance Measures
Motor Carrier Inspection (MCI)Program HistoryThe Federal Highway Administration (FHWA) is an agency within the U.S. Department of Transportation that supports State and local governments in the design, construction, and maintenance of the Nation's highway system (Federal Aid Highway Program) and various federally and tribal owned lands (Federal Lands Highway Program). Through financial and technical assistance to State and local governments, the Federal Highway Administration is responsible for ensuring that America's roads and highways continue to be among the safest and most technologically sound in the world. The Motor Carrier Inspection Program was transferred from the Department of Revenue to the KHP in FY 1989. The program was established to comply with federal highway funding requirements to reduce the number of oversize, overweight and/or unsafe commercial carriers traveling Kansas highways. On an annual basis, the KHP Commander for the Commercial Motor Vehicle Enforcement Unit oversees the submission of the State of Kansas Vehicle Size and Weight Enforcement Plan to the Kansas Department of Transportation (KDOT).
Consequences of Not Funding this ProgramThe agency is a subrecipient of federal funding from the Federal Highway Administration via Kansas Department of Transportation. Should funding from this entity be eliminated, the agency would be in violation of Kansas Statute as the agency would not be able to supplement funding to the extend the program operates today. The responsibilities would be absorbed and performed at a much reduced rate, or the role, along with the expenses, would be transferred to another state entity or private firm, thus reducing the oversight of the commercial trucking industry in Kansas and the risk that come with the reduction in monitoring this industry. Program GoalsA. To protect the infrastructure of highways in Kansas and to enhance the safety of motorists on Kansas roads by eliminating overweight and unsafe commercial motor vehicles from operating in Kansas. Motorist Assistance Program (MAP)Program HistoryIn 1994, Kansas Governor Joan Finney introduced the Motorist Assistance Program (MAP) in Kansas to elevate issues associated with disabled vehicles and high volume traffic areas. The program, developed by the Kansas Highway Patrol and the Kansas Department of Transportation, was modeled after existing programs in Virginia, Iowa, and Missouri. On June 17, 1995, the MAP was continued indefinitely. The MAP utilizes non-FTE unclassified employees to assist motorists traveling in or near the metropolitan areas of Topeka, Wichita, Salina, and Kansas City, Kansas and other areas in Kansas as directed by KHP & KDOT. The cost of the specially equipped vehicles, salaries and wages, and other operating expenditures is shared with the KDOT (80%) through the use of federal funds, with the remaining (20%) from the Highway Safety Fund. In 2005, MAP enhanced the Kansas City Scout Program by adding two system operators to the bi-state traffic management system designed by KDOT and MoDOT.
Consequences of Not Funding this ProgramFederal and State funds are the primary sources of capital for salaries and wages, commodities, contractual services, and capital outlay for the Motor Assistance Program. Without these funds, there would be an increase in trooper time required to perform non-law enforcement duties; reduced ability; and reduced timeliness in assisting stranded motorists on Kansas highways. The agency would not be in a position to subsidize this program without impacting resources (personnel & funding) for other programs. Program GoalsA. Protect and assist stranded motorists by reducing safety risks created by themselves and other drivers. B. Reducing congestion in the metropolitan areas during peak traffic hours by removal of disabled vehicles from traffic lanes. C. Assist State and local law enforcement agencies in the prevention of incidents that endanger motorists and disrupt traffic flow. D. Freeing road patrol troopers to perform duties requiring law enforcement powers through the cost-effect employment of non-sworn motorist assist technicians. Performance Measures
Operations SupportProgram HistoryThe Operations Program was established when the agency was formed in 1937 and contains most of the agency's staffing and operating costs. Expenditures in this program reflect the costs of performing the agency's main statutory purpose; to enforce traffic, criminal, and other laws. Historically the subprogram's main financing came from the State General Fund. However; the Legislature approved the elimination of SGF from the KHP's budget, and replaced the funding source with a transfer from the State Highway Fund, effective July 1, 2013. Effective July 1, 2010, several programs were incorporated into the "Operations Support" program due to the implementation of the new financial management system (SMART). The following programs are included under "Operations Support: Breath Alcohol Unit; Training Center; Civil Assessment; and Motor Carrier Safety Assistance Program.
Consequences of Not Funding this ProgramExpenditures in this program reflect the costs of performing the agency's main statutory purpose; to enforce traffic, criminal and other laws. Without funding, the agency would be unable to fulfill the mandated duties outlined by Kansas Statute and the responsibilities would then fall to the local law enforcement agencies to administer. Program GoalsA. Enforce the laws of the state relating to public and private motor carriers of passengers or property. Maximize public presence and road patrol by Troopers. B. Reduce the number and severity of traffic crashes through the enforcement of impaired driving and occupant protection laws. C. To reduce the number of impaired drivers operating vehicles on Kansas roadways. D. Deter motorists from driving impaired and will arrest impaired drivers through proven DUI countermeasures, such as selective enforcement efforts and sobriety check lanes. E. Pursue, apprehend, and prosecute those who utilize Kansas Highways for criminal activities. F. Promote the use of child restraints and safety belts through aggressive enforcement and educational programs. Performance Measures
Vehicle Identification Number (VIN)Program HistoryThe KHP was awarded a one-time Byrne grant for auto theft prevention that funded 2.0 positions previously budgeted in the SGF. The Vehicle Identification Number (VIN) Program was established in 1984 (KSA 8-116). Receipts to the VIN Fee Fund are derived from the fee charged for inspecting the title of a non-new vehicle brought into Kansas to be titled. The KHP charged $10 per inspection from 1984 until 2011. The fee increased to $15 per inspection in 2012 and was increased again in 2013 to $20 per inspection. In FY 2013, the grant ended and the positions are now funded with VIN fees. The positions funded with SGF were also moved to the VIN fee fund in FY 2013. The VIN program became self-sufficient in FY 2013 due to dedicated funding source.
Consequences of Not Funding this ProgramWithout funding, the VIN program would be in violation of Kansas Statute and unable to sustain the level of support to other law enforcement agencies, level of service to the citizen's of Kansas through the VIN inspection services, or continue the enforcements in an effort to identify stolen or illegally operated motor vehicles. Program GoalsA. Preserve the integrity of Kansas motor vehicle titles and to provide prompt and courteous service to our customers by increasing the detection and recovery of stolen vehicles and/or component parts; training other law enforcement agencies in auto theft and vehicle inspections; and working closely with the Kansas Department of Revenue in titling and registering vehicles. Performance Measures
Hutchinson Correctional FacilityAdministrationProgram HistoryIn 1885, the Kansas Legislature appropriated $1.0 million for the construction of The Kansas State Industrial Reformatory. The Reformatory was originally intended to serve as a reform school for first time youthful offenders. The Reformatory consisted of four cell houses, which opened between 1895 and 1927. The cell houses remained unchanged until 1978 when funds were appropriated for renovations. The renovations divided each of the large four-tier cellblocks into two separate, more manageable units. All renovations were completed by 1986. In 1995, an expansion project added 100 medium-security beds into the north side of the D cell house basement. The capacity was reduced during FY 1996 reduced to 76 to lessen the crowded condition. In 1971 the Legislature passed enabling statutes authorizing the establishment of work release programs. This led to the establishment of the Hutchinson Work Release Facility in January 1972. The program's purpose was placing inmates in a free community job placement to facilitate their transitional adjustment from the facility to society. In September 1978, the work release program moved from individual cellhouses inside the Reformatory to the former Warden's residence. In 1983, the Legislature appropriated money for a 96-bed, minimum-security facility. Construction of the facility began in September of 1984 and completed in May 1985. In 1986, the unit expanded to house an additional 64 inmates. In 1997, a 32-bed expansion for the work release population was approved by the Legislature and was constructed during FY 1998. The minimum custody residents housed in this unit are employed by private industries and in community work projects such as the State Fairgrounds, maintenance services, and grounds keeping duties for the correctional complex. In 1988 the Legislature authorized the creation of the Hutchinson Correctional Work Facility. A vacated mobile home manufacturing plant on 36 acres of land was purchased and KDOC staff and residents renovated 133,000 square feet of existing buildings. The medium custody facility was completed in January 1989 and the first of 400 medium and minimum custody residents were received on January 23, 1989. In 1990, the Kansas State Industrial Reformatory was renamed the Hutchinson Correctional Facility. In 1991, the Hutchinson Correctional Work Facility was merged into the Hutchinson Correctional Facility.
Consequences of Not Funding this ProgramThe Administration program provides for the overall management and operational control of the facility. This program includes the warden, human resources, mailroom, policy and compliance, staff development, and fiscal. Not funding this program would eliminate the leadership and support functions necessary to operate the facility. Program GoalsA. Operate and maintain a personnel system in accordance with state and departmental regulations, ensuring that positions are classified appropriately and that vacant positions are filled in a timely manner. B. Operate programs for existing and new employees that provide the training required by state law and departmental regulations. Performance Measures
Capital Improvements
Consequences of Not Funding this ProgramThe capital improvement program is used solely for budgeting and recording expenditures related to rehabilitation and repair projects. KDOC central office is appropriated $4,920,000 from the Correctional Institutions Building Fund annually for rehabilitation and repair projects throughout the KDOC system. Funds are transferred to the facility as projects are approved. Eliminating this program would prohibit the Department from making repairs, upgrades, and improvements to the facilities. Classification & ProgramsProgram HistoryIn 1885, the Kansas Legislature appropriated $1.0 million for the construction of The Kansas State Industrial Reformatory. The Reformatory was originally intended to serve as a reform school for first time youthful offenders. The Reformatory consisted of four cell houses, which opened between 1895 and 1927. The cell houses remained unchanged until 1978 when funds were appropriated for renovations. The renovations divided each of the large four-tier cellblocks into two separate, more manageable units. All renovations were completed by 1986. In 1995, an expansion project added 100 medium-security beds into the north side of the D cell house basement. The capacity was reduced during FY 1996 reduced to 76 to lessen the crowded condition. In 1971 the Legislature passed enabling statutes authorizing the establishment of work release programs. This led to the establishment of the Hutchinson Work Release Facility in January 1972. The program's purpose was placing inmates in a free community job placement to facilitate their transitional adjustment from the facility to society. In September 1978, the work release program moved from individual cellhouses inside the Reformatory to the former Warden's residence. In 1983, the Legislature appropriated money for a 96-bed, minimum-security facility. Construction of the facility began in September of 1984 and completed in May 1985. In 1986, the unit expanded to house an additional 64 inmates. In 1997, a 32-bed expansion for the work release population was approved by the Legislature and was constructed during FY 1998. The minimum custody residents housed in this unit are employed by private industries and in community work projects such as the State Fairgrounds, maintenance services, and grounds keeping duties for the correctional complex. In 1988 the Legislature authorized the creation of the Hutchinson Correctional Work Facility. A vacated mobile home manufacturing plant on 36 acres of land was purchased and KDOC staff and residents renovated 133,000 square feet of existing buildings. The medium custody facility was completed in January 1989 and the first of 400 medium and minimum custody residents were received on January 23, 1989. In 1990, the Kansas State Industrial Reformatory was renamed the Hutchinson Correctional Facility. In 1991, the Hutchinson Correctional Work Facility was merged into the Hutchinson Correctional Facility.
Consequences of Not Funding this ProgramThis program includes Classification and Records and various support functions. Classification and Records are responsible for the reporting and recording of all pertinent information regarding the movement and progress of residents at the facility, to included establishment of legal authority to incarcerate, movement, behavior, progress, disciplinary history, and program participation. Under the coordination of the unit teams, an individualized treatment program is developed, implemented, and maintained for each resident. Each resident, as well as facility staff, is kept aware of the resident's status within the correctional process. This program provides direct case management to the inmates, holding them accountable for their behavior, while identifying and localizing problems within each unit. Also include in this program are chaplain services, library services, and recreation. Not funding this program would eliminate the processes and activities that are critical to appropriate placement, documentation, and treatment plan development and implementation. Program GoalsA. To provide effective caseload management from reception to release of offenders from confinement. Performance Measures
SecurityProgram HistoryIn 1885, the Kansas Legislature appropriated $1.0 million for the construction of The Kansas State Industrial Reformatory. The Reformatory was originally intended to serve as a reform school for first time youthful offenders. The Reformatory consisted of four cell houses, which opened between 1895 and 1927. The cell houses remained unchanged until 1978 when funds were appropriated for renovations. The renovations divided each of the large four-tier cellblocks into two separate, more manageable units. All renovations were completed by 1986. In 1995, an expansion project added 100 medium-security beds into the north side of the D cell house basement. The capacity was reduced during FY 1996 reduced to 76 to lessen the crowded condition. In 1971 the Legislature passed enabling statutes authorizing the establishment of work release programs. This led to the establishment of the Hutchinson Work Release Facility in January 1972. The program's purpose was placing inmates in a free community job placement to facilitate their transitional adjustment from the facility to society. In September 1978, the work release program moved from individual cellhouses inside the Reformatory to the former Warden's residence. In 1983, the Legislature appropriated money for a 96-bed, minimum-security facility. Construction of the facility began in September of 1984 and completed in May 1985. In 1986, the unit expanded to house an additional 64 inmates. In 1997, a 32-bed expansion for the work release population was approved by the Legislature and was constructed during FY 1998. The minimum custody residents housed in this unit are employed by private industries and in community work projects such as the State Fairgrounds, maintenance services, and grounds keeping duties for the correctional complex. In 1988 the Legislature authorized the creation of the Hutchinson Correctional Work Facility. A vacated mobile home manufacturing plant on 36 acres of land was purchased and KDOC staff and residents renovated 133,000 square feet of existing buildings. The medium custody facility was completed in January 1989 and the first of 400 medium and minimum custody residents were received on January 23, 1989. In 1990, the Kansas State Industrial Reformatory was renamed the Hutchinson Correctional Facility. In 1991, the Hutchinson Correctional Work Facility was merged into the Hutchinson Correctional Facility.
Consequences of Not Funding this ProgramThe Security program include salaries and wages for all uniformed security officers and operating expenses, such as clothing, drug testing, and security equipment. This program is essential to operating the facility. Program GoalsA. To maintain an effective posture of physical/perimeter security as measured by the KDOC Security Inspection and accreditation audits. B. To effectively control unsanctioned prison groups in the prison population through proper identification, tracking, intelligence gathering techniques, and management strategies. C. To maintain a safe environment for incarcerated offenders. Performance Measures
Support ServicesProgram HistoryIn 1885, the Kansas Legislature appropriated $1.0 million for the construction of The Kansas State Industrial Reformatory. The Reformatory was originally intended to serve as a reform school for first time youthful offenders. The Reformatory consisted of four cell houses, which opened between 1895 and 1927. The cell houses remained unchanged until 1978 when funds were appropriated for renovations. The renovations divided each of the large four-tier cellblocks into two separate, more manageable units. All renovations were completed by 1986. In 1995, an expansion project added 100 medium-security beds into the north side of the D cell house basement. The capacity was reduced during FY 1996 reduced to 76 to lessen the crowded condition. In 1971 the Legislature passed enabling statutes authorizing the establishment of work release programs. This led to the establishment of the Hutchinson Work Release Facility in January 1972. The program's purpose was placing inmates in a free community job placement to facilitate their transitional adjustment from the facility to society. In September 1978, the work release program moved from individual cellhouses inside the Reformatory to the former Warden's residence. In 1983, the Legislature appropriated money for a 96-bed, minimum-security facility. Construction of the facility began in September of 1984 and completed in May 1985. In 1986, the unit expanded to house an additional 64 inmates. In 1997, a 32-bed expansion for the work release population was approved by the Legislature and was constructed during FY 1998. The minimum custody residents housed in this unit are employed by private industries and in community work projects such as the State Fairgrounds, maintenance services, and grounds keeping duties for the correctional complex. In 1988 the Legislature authorized the creation of the Hutchinson Correctional Work Facility. A vacated mobile home manufacturing plant on 36 acres of land was purchased and KDOC staff and residents renovated 133,000 square feet of existing buildings. The medium custody facility was completed in January 1989 and the first of 400 medium and minimum custody residents were received on January 23, 1989. In 1990, the Kansas State Industrial Reformatory was renamed the Hutchinson Correctional Facility. In 1991, the Hutchinson Correctional Work Facility was merged into the Hutchinson Correctional Facility.
Consequences of Not Funding this ProgramFunctions included in this program consist of maintenance, laundry, warehouse operations. Also included in this program are utility expenditures. Not funding the support services program would eliminate funding necessary for the operation and maintenance of the facility. TransportationProgram HistoryThe Transportation Unit began operation in March 1989 to provide for the orderly and secure movement of inmates utilizing a regularly scheduled program of transportation, while employing needed security measures to prevent escape and ensure the safety of escort personnel and the public. The unit was originally divided into two hub operations; one hub was located at the Lansing Correctional Facility and the other at the Hutchinson Correctional Facility. Early in 1998, a third hub was established at Norton Correctional Facility.
Consequences of Not Funding this ProgramTransportation between correctional facilities, to and from other jurisdictions in the state, and out-of-state is coordinated through Central Transportation Coordinator at the Hutchinson Correctional Facility. Transportation hubs are also located at the Lansing and Norton Correctional Facilities. Elimination of this program would result in a decentralized system operated by individual facilities. Program GoalsA. To provide for the safe and secure transportation of inmates during inter-facility transfers and of those inmates being returned for parole violations. Performance Measures
Kansas Bureau of InvestigationAdministrationProgram HistoryThis program has been established and is dedicated to support the other divisions of the bureau and provide criminal justice information to public and private agencies.
Consequences of Not Funding this ProgramWithout funding for this program there would be a complete loss of leadership and overhead functions for the Kansas Bureau of Investigation. Program GoalsA. Administration division includes the office of the director which is the agency's central management. It also includes governmental affairs, fiscal office, office of general counsel, human resources office, office of communications and engagement, office of professional standards and facilities operations. These divisions have the vital responsibility of providing accurate information and timely services to support the operations of the bureau. B. Maintain a vacancy level below 5% as compared to established staffing levels. This includes both FTE and Non-FTE positions. Performance Measures
Field Investigation DivisionProgram HistoryKansas Statutes Annotated 75-712, enacted by the Kansas legislature in 1939, empowered members of the KBI to make full and complete investigations at the direction of the attorney general. This orginating statute embued the power and authority of a Kansas Sheriff to the commissioned members of the KBI.
Consequences of Not Funding this ProgramThe Field Investigation Division (FID) investigates approximately 200 violent person crimes per year. In particular, the division investigates about 80 suspicious death cases per year and about 25 to 30 of those are actually murders. The FID investigates approximately 45 to 50 cases per year involving public officials. The elimination of this program would be catastrophic to public safety in Kansas, particularly in the rural areas. Program GoalsA. The Field Investigations Division (FID) will endeavor to provide professional investigative assistance to local, state, and federal law enforcement agencies in response to all requests for assistance. Performance Measures
Forensic Laboratory DivisionProgram HistoryThe Kansas Bureau of Investigation Forensic Science Laboratory began in the 1950's with a latent prints section and photograph unit. The laboratory expanded and over the years regional laboratories were placed in Great Bend, Kansas City and Pittsburg to provide regional services and support required by Kansas law enforcement.
Consequences of Not Funding this ProgramThe laboratory will be unable to provide information to Kansas law enforcement and the courts relating to the identification of weapons and firearm components, digital evidence, the identify of suspect prints, the presence of alcohol or drugs which may have contributed to impairment, determining if a substance is controlled under State or Federal law, identifying suspects which will result in criminal remaining free to prey on other victims and arrestee sampes would not be profiled and loaded into CODIS. Program GoalsA. To provide timely, state of the art forensic science services to the Kansas criminal justice system. Our employees are dedicated to preserving the safety of all Kansas citizens through the application of science and modern technology. To ensure the interpretation of evidence is meaningful, objective, and free of bias. Performance Measures
Information Services DivisionProgram HistoryPursuant to KSA 22-4701 et seq, the KBI is required to maintain the central repository for criminal history records for the State of Kansas. These records include fingerprint-based arrests, filings, and dispositions for criminal cases. In 2011, after the conclusion of the DUI Commission, the Legislature mandated that DUI filings and dispositions be reported electronically to the KBI central repository. As required by KSA 22-4901 et seq, the KBI also maintains the central repository for all registered offenders in the State of Kansas.
Consequences of Not Funding this ProgramThe Criminal History Record Information Act requires the KBI to develop and maintain the central repository for defined criminal history records. Statute requires the KBI to collect law enforcement agencies offense reports. This is accomlished by collecting electronic and manual entry of Kansas Standard Offense Reports and Kansas Standard Arrest Reports into the KIBRS repository. Offender Registration Act requires KBI to maintain offender registration for sex, violent, and drug offenders and make available on a public website. Program GoalsA. Enhance public safety in Kansas by providing the public with information regarding convicted offenders who could pose a threat, providing Kansas criminal history record checks and providing valuable statistical crime information in Kansas to local law enforcement partners through incident based reporting. Performance Measures
KCJIS & ITProgram HistorySince the functional inception of Kansas Criminal Justice Information System (KCJIS) in 2000, the KBI has committed the financial resources and technical staff necessary to enhance and maintain the KCJIS, and to ensuring the information critical to officer and public safety remains useful and accessible. Over these years, demand for the information KCJIS provides has grown, and statutory and regulatory requirements related to this information have continued to evolve and demand continued modification of the system.
Consequences of Not Funding this ProgramLoss of access to out of state users to critical points of contact within the state for criminal justice information. Significant negative impact on public safety in Kansas due to local, state, and federal criminal justice partners (including law enforcement, prosecutors, and courts) losing access to critical operational real-time information access via KCJIS. Degredation of quality of information available to local, state, and federal criminal justice partners (including law enforcement, prosecutors and courts), as well as non-criminal justice partners (state agencies requiring restricted access to criminal justice information for business purposes). Program GoalsA. To maintain a secure, highly available, and responsive network capable of transporting criminal justice and related information to and from public and private agencies for the purpose of promoting public safety and the prevention of crime in Kansas. B. Develop, deploy, and maintain high availability solutions for critical systems. Performance Measures
Special Operations DivisionProgram HistoryKansas Statutes Annotated 75-712, enacted by the Kansas legislature in 1939, empowered members of the KBI to make full and complete investigations at the direction of the attorney general. This orginating statute embued the power and authority of a Kansas Sheriff to the commissioned members of the KBI.
Consequences of Not Funding this ProgramThe majority of Special Operations Division's (SOD) investigations target drug trafficking and manufacturing group, thus working to reduce the availability of illicit and dangerous drugs in Kansas communities. The elimination of this program would be catastrophic to public safety in Kansas, particularly in the rural areas. Program GoalsA. The Special Operations Division of the Kansas Bureau of Investigation is dedicated to enhancing public safety in Kansas by providing professional investigative, technical, and tactical services to the criminal justice community. The SOD prioritizes its investigations toward organized criminal groups and career criminal offenders, especially those engaged in drug manufacture and distribution, weapons offenses and other acts of violence. The SOD will provide an efficient response for criminal investigations and to assist in the timely arrest or charging of any suspect of a criminal act, and, to that end, will endeavor to substantially complete every criminal investigation within 90 days. The SOD primary goal is to help ensure public safety in Kansas. Performance Measures
Kansas Juvenile Correctional ComplexAdministrationProgram HistoryIn 1879, the Legislature provided for the selection of a site for a state reform school under control of State Charitable Institutions. The school received its first two residents on June 6, 1881. In 1901, the name of the school was changed to The State Industrial School for Boys and on July 1, 1974, the name was changed again to the Youth Center at Topeka. The Juvenile Justice Reform Act of 1996 created the Juvenile Justice Authority (JJA) and on July 1, 1997, JJA assumed responsibility for the operation of the four juvenile correctional facilities. At this time the was changed to Topeka Juvenile Correctional Facility (TJCF). On July 1, 1999, a sentencing matrix went into effect defining minimum and maximum sentence based on the offense. Prior to this, facility superintendents had the authority to determine when a juvenile could be released. The matrix included mandatory aftercare for all youth following their release. In 2000, the Legislature approved the construction of the Kansas Juvenile Correctional Complex (KJCC), which is composed of a reception and diagnostic center, a maximum-security facility, central program areas, and administrative/support areas. Construction began in April 2001. The original intent was for KJCC and TJCF to be operated as separate facilities. However, the sentencing reforms that went into effect in 1999 caused the juvenile offender population to sharply decline. When construction was complete, it was decided to shift operations from TJCF to KJCC in the spring of 2005 and close TJCF. The continued decline in the juvenile offender population coupled with budgetary constraints led to the closure of the Atchison Juvenile Correctional Facility in 2008 and the Beloit Juvenile Correctional Facility in 2009. The male population from Atchison was integrated into the main facility at KJCC while the female population from Beloit was moved to two units on the former TJCF campus. This area of the facility was referred to as KJCC - West. In September 2011, the female population was moved into the stand-alone Q/R/S/T building on the KJCC campus. On July 1, 2013, JJA was merged into the Kansas Department of Corrections in accordance with Executive Reorganization Order 42. In 2017, the Larned Juvenile Correctional Facility closed, leaving KJCC as the sole juvenile correctional facility in the state.
Consequences of Not Funding this ProgramThe Administration program provides for the overall management and operational control of the facility. This program includes the superintendent, human resources, mailroom, policy and compliance, staff development, and fiscal. Not funding this program would eliminate the leadership and support functions necessary to operate the facility. Program GoalsA. Operate and maintain a personnel system in accordance with state and departmental regulations, ensuring that positions are classified appropriately and that vacant positions are filled in a timely manner. B. Operate programs for existing and new employees that provide the training required by state law and departmental regulations. Performance Measures
Ancillary ServicesProgram HistoryIn 1879, the Legislature provided for the selection of a site for a state reform school under control of State Charitable Institutions. The school received its first two residents on June 6, 1881. In 1901, the name of the school was changed to The State Industrial School for Boys and on July 1, 1974, the name was changed again to the Youth Center at Topeka. The Juvenile Justice Reform Act of 1996 created the Juvenile Justice Authority (JJA) and on July 1, 1997, JJA assumed responsibility for the operation of the four juvenile correctional facilities. At this time the was changed to Topeka Juvenile Correctional Facility (TJCF). On July 1, 1999, a sentencing matrix went into effect defining minimum and maximum sentence based on the offense. Prior to this, facility superintendents had the authority to determine when a juvenile could be released. The matrix included mandatory aftercare for all youth following their release. In 2000, the Legislature approved the construction of the Kansas Juvenile Correctional Complex (KJCC), which is composed of a reception and diagnostic center, a maximum-security facility, central program areas, and administrative/support areas. Construction began in April 2001. The original intent was for KJCC and TJCF to be operated as separate facilities. However, the sentencing reforms that went into effect in 1999 caused the juvenile offender population to sharply decline. When construction was complete, it was decided to shift operations from TJCF to KJCC in the spring of 2005 and close TJCF. The continued decline in the juvenile offender population coupled with budgetary constraints led to the closure of the Atchison Juvenile Correctional Facility in 2008 and the Beloit Juvenile Correctional Facility in 2009. The male population from Atchison was integrated into the main facility at KJCC while the female population from Beloit was moved to two units on the former TJCF campus. This area of the facility was referred to as KJCC - West. In September 2011, the female population was moved into the stand-alone Q/R/S/T building on the KJCC campus. On July 1, 2013, JJA was merged into the Kansas Department of Corrections in accordance with Executive Reorganization Order 42. In 2017, the Larned Juvenile Correctional Facility closed, leaving KJCC as the sole juvenile correctional facility in the state.
Consequences of Not Funding this ProgramA corrections counselor is assigned to each youth during his or her commitment. Counselors provide program planning, case management, individual behavior modification work, reintegration/re-entry programming, and life skills classes. In conjunction with Community Supervision Agencies and the family, counselors assist in developing aftercare plans with each youth. Youth are offered large-muscle activities daily by activity therapy. During activities, youth are afforded the opportunity to learn the rules and fundamentals of several socially acceptable sporting events and leisure time activities. A part-time chaplain is available to all youth for individual pastoral counseling, weekly worship, and bible study. Special religious events are conducted as well as services recognizing religious holidays and seasons. Participation by the offenders in any religious service or activity is voluntary. Many volunteers also assist the agency's religious programs and conduct several groups. Not funding this program would eliminate services that critical to a youth's rehabilitation and return to the community. Program GoalsA. Develop and continuously evaluate programs. Performance Measures
Capital Improvements
Consequences of Not Funding this ProgramThe capital improvement program is used solely for budgeting and recording expenditures related to rehabilitation and repair projects. KDOC central office is appropriated $500,000 from the State Institutions Building Fund annually for rehabilitation and repair projects at KJCC. Funds are transferred to the facility as projects are approved. Eliminating this program would prohibit the Department from making repairs, upgrades, and improvements. Central ServicesProgram HistoryIn 1879, the Legislature provided for the selection of a site for a state reform school under control of State Charitable Institutions. The school received its first two residents on June 6, 1881. In 1901, the name of the school was changed to The State Industrial School for Boys and on July 1, 1974, the name was changed again to the Youth Center at Topeka. The Juvenile Justice Reform Act of 1996 created the Juvenile Justice Authority (JJA) and on July 1, 1997, JJA assumed responsibility for the operation of the four juvenile correctional facilities. At this time the was changed to Topeka Juvenile Correctional Facility (TJCF). On July 1, 1999, a sentencing matrix went into effect defining minimum and maximum sentence based on the offense. Prior to this, facility superintendents had the authority to determine when a juvenile could be released. The matrix included mandatory aftercare for all youth following their release. In 2000, the Legislature approved the construction of the Kansas Juvenile Correctional Complex (KJCC), which is composed of a reception and diagnostic center, a maximum-security facility, central program areas, and administrative/support areas. Construction began in April 2001. The original intent was for KJCC and TJCF to be operated as separate facilities. However, the sentencing reforms that went into effect in 1999 caused the juvenile offender population to sharply decline. When construction was complete, it was decided to shift operations from TJCF to KJCC in the spring of 2005 and close TJCF. The continued decline in the juvenile offender population coupled with budgetary constraints led to the closure of the Atchison Juvenile Correctional Facility in 2008 and the Beloit Juvenile Correctional Facility in 2009. The male population from Atchison was integrated into the main facility at KJCC while the female population from Beloit was moved to two units on the former TJCF campus. This area of the facility was referred to as KJCC - West. In September 2011, the female population was moved into the stand-alone Q/R/S/T building on the KJCC campus. On July 1, 2013, JJA was merged into the Kansas Department of Corrections in accordance with Executive Reorganization Order 42. In 2017, the Larned Juvenile Correctional Facility closed, leaving KJCC as the sole juvenile correctional facility in the state.
Consequences of Not Funding this ProgramFunctions included in this program consist of maintenance, laundry, warehouse operations, and food service. Also included in this program are utility expenditures. Not funding the support services program would eliminate funding necessary for the operation and maintenance of the facility. Program GoalsA. Effective community-based juvenile justice programs are available to all Kansas youth and their families. EducationProgram HistoryIn 1879, the Legislature provided for the selection of a site for a state reform school under control of State Charitable Institutions. The school received its first two residents on June 6, 1881. In 1901, the name of the school was changed to The State Industrial School for Boys and on July 1, 1974, the name was changed again to the Youth Center at Topeka. The Juvenile Justice Reform Act of 1996 created the Juvenile Justice Authority (JJA) and on July 1, 1997, JJA assumed responsibility for the operation of the four juvenile correctional facilities. At this time the was changed to Topeka Juvenile Correctional Facility (TJCF). On July 1, 1999, a sentencing matrix went into effect defining minimum and maximum sentence based on the offense. Prior to this, facility superintendents had the authority to determine when a juvenile could be released. The matrix included mandatory aftercare for all youth following their release. In 2000, the Legislature approved the construction of the Kansas Juvenile Correctional Complex (KJCC), which is composed of a reception and diagnostic center, a maximum-security facility, central program areas, and administrative/support areas. Construction began in April 2001. The original intent was for KJCC and TJCF to be operated as separate facilities. However, the sentencing reforms that went into effect in 1999 caused the juvenile offender population to sharply decline. When construction was complete, it was decided to shift operations from TJCF to KJCC in the spring of 2005 and close TJCF. The continued decline in the juvenile offender population coupled with budgetary constraints led to the closure of the Atchison Juvenile Correctional Facility in 2008 and the Beloit Juvenile Correctional Facility in 2009. The male population from Atchison was integrated into the main facility at KJCC while the female population from Beloit was moved to two units on the former TJCF campus. This area of the facility was referred to as KJCC - West. In September 2011, the female population was moved into the stand-alone Q/R/S/T building on the KJCC campus. On July 1, 2013, JJA was merged into the Kansas Department of Corrections in accordance with Executive Reorganization Order 42. In 2017, the Larned Juvenile Correctional Facility closed, leaving KJCC as the sole juvenile correctional facility in the state.
Consequences of Not Funding this ProgramThe education program consists of several different components designed to meet the needs of all students at the facility. The academic program consists of high school coursework and remedial coursework geared toward helping a student earn a high school diploma or the GED. The program is required to meet all the Quality Performance Accreditation requirements set for schools by the Kansas State Department of Education. Also included is an institution-wide Title I program designed to help students struggling in reading, writing, and math to improve their academic skills. Special education services are offered for all exceptional students with a current individual education plan (IEP). Not funding this program would eliminate education services and place youth who are already behind academically even further behind their peers when they release. Program GoalsA. Provide juvenile offenders with the life and competency skills necessary to function in society. Performance Measures
SecurityProgram HistoryIn 1879, the Legislature provided for the selection of a site for a state reform school under control of State Charitable Institutions. The school received its first two residents on June 6, 1881. In 1901, the name of the school was changed to The State Industrial School for Boys and on July 1, 1974, the name was changed again to the Youth Center at Topeka. The Juvenile Justice Reform Act of 1996 created the Juvenile Justice Authority (JJA) and on July 1, 1997, JJA assumed responsibility for the operation of the four juvenile correctional facilities. At this time the was changed to Topeka Juvenile Correctional Facility (TJCF). On July 1, 1999, a sentencing matrix went into effect defining minimum and maximum sentence based on the offense. Prior to this, facility superintendents had the authority to determine when a juvenile could be released. The matrix included mandatory aftercare for all youth following their release. In 2000, the Legislature approved the construction of the Kansas Juvenile Correctional Complex (KJCC), which is composed of a reception and diagnostic center, a maximum-security facility, central program areas, and administrative/support areas. Construction began in April 2001. The original intent was for KJCC and TJCF to be operated as separate facilities. However, the sentencing reforms that went into effect in 1999 caused the juvenile offender population to sharply decline. When construction was complete, it was decided to shift operations from TJCF to KJCC in the spring of 2005 and close TJCF. The continued decline in the juvenile offender population coupled with budgetary constraints led to the closure of the Atchison Juvenile Correctional Facility in 2008 and the Beloit Juvenile Correctional Facility in 2009. The male population from Atchison was integrated into the main facility at KJCC while the female population from Beloit was moved to two units on the former TJCF campus. This area of the facility was referred to as KJCC - West. In September 2011, the female population was moved into the stand-alone Q/R/S/T building on the KJCC campus. On July 1, 2013, JJA was merged into the Kansas Department of Corrections in accordance with Executive Reorganization Order 42. In 2017, the Larned Juvenile Correctional Facility closed, leaving KJCC as the sole juvenile correctional facility in the state.
Consequences of Not Funding this ProgramThe Security program include salaries and wages for all uniformed security officers. This program is essential to operating the facility. Program GoalsA. Provide a safe and security environment for staff and juvenile offenders within the facility. Performance Measures
Lansing Correctional FacilityAdministrationProgram HistoryThe Kansas State Penitentiary was authorized by Article VII, Section 2, of the Kansas Constitution in 1859. On November 19, 1861, the land for the prison was purchased in Leavenworth County and construction on the prison started in 1864, near the site of the old Oklahoma Territorial Prison. Completion was delayed by the Civil War. Additional ground purchases were made in the late 1800s and early 1900s. In 1917 the Legislature established the State Industrial Farm for Women at Lansing. This institution was later renamed the Kansas Correctional Institution at Lansing (KCIL) and later housed both male and female residents. In 1995 the female residents were transferred to the Topeka Correctional Facility. To address the growing inmate population, a medium security facility was constructed next to the original maximum-security facility in the 1980s. In 1990 KCIL and the Kansas State Penitentiary were consolidated and renamed the Lansing Correctional Facility. In 2018 the medium security facility was demolished and a new facility to house maximum and medium custody offenders was constructed on the site. The same project also replaced the minimum-security East Unit (the former KCIL) with a new 512-bed unit. Residents were moved into the new minimum unit in December 2019 and the new medium/maximum unit was occupied in April 2020.
Consequences of Not Funding this ProgramThe Administration program provides for the overall management and operational control of the facility. This program includes the warden, human resources, mailroom, policy and compliance, staff development, and fiscal. Not funding this program would eliminate the leadership and support functions necessary to operate the facility. Program GoalsA. Operate and maintain a personnel system in accordance with state and departmental regulations, ensuring that positions are classified appropriately and that vacant positions are filled in a timely manner. B. Operate programs for existing and new employees that provide the training required by state law and departmental regulations. Performance Measures
Capital Improvements
Consequences of Not Funding this ProgramThe capital improvement program is used solely for budgeting and recording expenditures related to rehabilitation and repair projects. KDOC central office is appropriated $4,920,000 from the Correctional Institutions Building Fund annually for rehabilitation and repair projects throughout the KDOC system. Funds are transferred to the facility as projects are approved. Eliminating this program would prohibit the Department from making repairs, upgrades, and improvements to the facilities. Classification & ProgramsProgram HistoryThe Kansas State Penitentiary was authorized by Article VII, Section 2, of the Kansas Constitution in 1859. On November 19, 1861, the land for the prison was purchased in Leavenworth County and construction on the prison started in 1864, near the site of the old Oklahoma Territorial Prison. Completion was delayed by the Civil War. Additional ground purchases were made in the late 1800s and early 1900s. In 1917 the Legislature established the State Industrial Farm for Women at Lansing. This institution was later renamed the Kansas Correctional Institution at Lansing (KCIL) and later housed both male and female residents. In 1995 the female residents were transferred to the Topeka Correctional Facility. To address the growing inmate population, a medium security facility was constructed next to the original maximum-security facility in the 1980s. In 1990 KCIL and the Kansas State Penitentiary were consolidated and renamed the Lansing Correctional Facility. In 2018 the medium security facility was demolished and a new facility to house maximum and medium custody offenders was constructed on the site. The same project also replaced the minimum-security East Unit (the former KCIL) with a new 512-bed unit. Residents were moved into the new minimum unit in December 2019 and the new medium/maximum unit was occupied in April 2020.
Consequences of Not Funding this ProgramThis program includes Classification and Records and various support functions. Classification and Records are responsible for the reporting and recording of all pertinent information regarding the movement and progress of residents at the facility, to included establishment of legal authority to incarcerate, movement, behavior, progress, disciplinary history, and program participation. Under the coordination of the unit teams, an individualized treatment program is developed, implemented, and maintained for each resident. Each resident, as well as facility staff, is kept aware of the resident's status within the correctional process. This program provides direct case management to the inmates, holding them accountable for their behavior, while identifying and localizing problems within each unit. Also include in this program are chaplain services, library services, and recreation. Not funding this program would eliminate the processes and activities that are critical to appropriate placement, documentation, and treatment plan development and implementation. Program GoalsA. To provide effective caseload management from reception to release of offenders from confinement. Performance Measures
SecurityProgram HistoryThe Kansas State Penitentiary was authorized by Article VII, Section 2, of the Kansas Constitution in 1859. On November 19, 1861, the land for the prison was purchased in Leavenworth County and construction on the prison started in 1864, near the site of the old Oklahoma Territorial Prison. Completion was delayed by the Civil War. Additional ground purchases were made in the late 1800s and early 1900s. In 1917 the Legislature established the State Industrial Farm for Women at Lansing. This institution was later renamed the Kansas Correctional Institution at Lansing (KCIL) and later housed both male and female residents. In 1995 the female residents were transferred to the Topeka Correctional Facility. To address the growing inmate population, a medium security facility was constructed next to the original maximum-security facility in the 1980s. In 1990 KCIL and the Kansas State Penitentiary were consolidated and renamed the Lansing Correctional Facility. In 2018 the medium security facility was demolished and a new facility to house maximum and medium custody offenders was constructed on the site. The same project also replaced the minimum-security East Unit (the former KCIL) with a new 512-bed unit. Residents were moved into the new minimum unit in December 2019 and the new medium/maximum unit was occupied in April 2020.
Consequences of Not Funding this ProgramThe Security program include salaries and wages for all uniformed security officers and operating expenses, such as clothing, drug testing, and security equipment. This program is essential to operating the facility. Program GoalsA. To maintain an effective posture of physical/perimeter security as measured by the KDOC Security Inspection and accreditation audits. B. To effectively control unsanctioned prison groups in the prison population through proper identification, tracking, intelligence gathering techniques, and management strategies. C. To maintain a safe environment for incarcerated offenders. Performance Measures
Support ServicesProgram HistoryThe Kansas State Penitentiary was authorized by Article VII, Section 2, of the Kansas Constitution in 1859. On November 19, 1861, the land for the prison was purchased in Leavenworth County and construction on the prison started in 1864, near the site of the old Oklahoma Territorial Prison. Completion was delayed by the Civil War. Additional ground purchases were made in the late 1800s and early 1900s. In 1917 the Legislature established the State Industrial Farm for Women at Lansing. This institution was later renamed the Kansas Correctional Institution at Lansing (KCIL) and later housed both male and female residents. In 1995 the female residents were transferred to the Topeka Correctional Facility. To address the growing inmate population, a medium security facility was constructed next to the original maximum-security facility in the 1980s. In 1990 KCIL and the Kansas State Penitentiary were consolidated and renamed the Lansing Correctional Facility. In 2018 the medium security facility was demolished and a new facility to house maximum and medium custody offenders was constructed on the site. The same project also replaced the minimum-security East Unit (the former KCIL) with a new 512-bed unit. Residents were moved into the new minimum unit in December 2019 and the new medium/maximum unit was occupied in April 2020.
Consequences of Not Funding this ProgramFunctions included in this program consist of maintenance, laundry, warehouse operations. Also included in this program are utility expenditures. Not funding the support services program would eliminate funding necessary for the operation and maintenance of the facility. TransportationProgram HistoryThe Transportation Unit began operation in March 1989 to provide for the orderly and secure movement of inmates utilizing a regularly scheduled program of transportation, while employing needed security measures to prevent escape and ensure the safety of escort personnel and the public. The unit was originally divided into two hub operations; one hub was located at the Lansing Correctional Facility and the other at the Hutchinson Correctional Facility. Early in 1998, a third hub was established at Norton Correctional Facility.
Consequences of Not Funding this ProgramTransportation between correctional facilities, to and from other jurisdictions in the state, and out-of-state is coordinated through Central Transportation Coordinator at the Hutchinson Correctional Facility. Transportation hubs are also located at the Lansing and Norton Correctional Facilities. Elimination of this program would result in a decentralized system operated by individual facilities. Program GoalsA. To provide for the safe and secure transportation of inmates during inter-facility transfers and of those inmates being returned for parole violations. Performance Measures
Larned State Correctional FacilityAdministrationProgram HistoryThe Larned Correctional Mental Health Facility (LCMHF) was built in response to an April 1989 federal court order, which directed that the State develop and implement an acceptable long-term plan for the mentally ill, protective custody, and high-security offenders. Construction of the 150- bed facility began on the grounds of the Larned State Hospital (LSH) in January 1991, and the facility was dedicated in December of that same year. The facility was designed with a shared services concept in mind. Under this concept, Larned State Hospital would provide food service, laundry, and warehouse function for the correctional facility. As such, the new facility was designed with minimal warehouse, kitchen, and support services space. In 1996, the Department entered into a lease with the LSH to utilize a vacant building for housing minimum-security residents. This unit was designated the LCMHF -West Unit. Most residents housed in the West Unit were assigned to work details at LCMHF or LSH, though some residents were assigned to private industry jobs. These jobs allow residents to begin saving and preparing for eventual release and to begin paying for such expenses as room and board, transportation, court costs, fines, restitution, child support and taxes while they are still incarcerated. During FY 2017, the mental health program at Larned was moved to El Dorado. This allowed LCMHF to double bunk and increase Central Unit capacity from 150 to 300. In addition, this move allowed KDOC to increase mental health beds from 150 to 190 and have access to a larger recruiting pool for mental health staff. At the onset of the COVID-19 pandemic, KDOC reopened the former Larned Juvenile Correctional Facility for use as an intake isolation unit. Redesignated LCMHF - South Unit, new male admissions were housed in this unit for a two-week quarantine before moving on to the reception and diagnostic unit at El Dorado. Later, this unit was used to house older residents at risk of COVID-19 complications that were previously house in an open dorm setting. In 2021, the West Unit population was moved to the South Unit. This allowed KDOC to take advantage of the more efficient designed that required fewer staff as well as the improved ventilation systems. On July 1, 2021, KDOC's contract food service provider took over the food service operation at LCMHF. The lower cost per meal under the KDOC contract generated an estimated net savings of $2.1 million in savings to the state and improved efficiencies at both LCMHF and LSH.
Consequences of Not Funding this ProgramThe Administration program provides for the overall management and operational control of the facility. This program includes the warden, human resources, mailroom, policy and compliance, staff development, and fiscal. Not funding this program would eliminate the leadership and support functions necessary to operate the facility. Program GoalsA. Operate and maintain a personnel system in accordance with state and departmental regulations, ensuring that positions are classified appropriately and that vacant positions are filled in a timely manner. B. Operate programs for existing and new employees that provide the training required by state law and departmental regulations. Performance Measures
Capital Improvements
Consequences of Not Funding this ProgramThe capital improvement program is used solely for budgeting and recording expenditures related to rehabilitation and repair projects. KDOC central office is appropriated $4,920,000 from the Correctional Institutions Building Fund annually for rehabilitation and repair projects throughout the KDOC system. Funds are transferred to the facility as projects are approved. Eliminating this program would prohibit the Department from making repairs, upgrades, and improvements to the facilities. Classification & ProgramsProgram HistoryThe Larned Correctional Mental Health Facility (LCMHF) was built in response to an April 1989 federal court order, which directed that the State develop and implement an acceptable long-term plan for the mentally ill, protective custody, and high-security offenders. Construction of the 150- bed facility began on the grounds of the Larned State Hospital (LSH) in January 1991, and the facility was dedicated in December of that same year. The facility was designed with a shared services concept in mind. Under this concept, Larned State Hospital would provide food service, laundry, and warehouse function for the correctional facility. As such, the new facility was designed with minimal warehouse, kitchen, and support services space. In 1996, the Department entered into a lease with the LSH to utilize a vacant building for housing minimum-security residents. This unit was designated the LCMHF -West Unit. Most residents housed in the West Unit were assigned to work details at LCMHF or LSH, though some residents were assigned to private industry jobs. These jobs allow residents to begin saving and preparing for eventual release and to begin paying for such expenses as room and board, transportation, court costs, fines, restitution, child support and taxes while they are still incarcerated. During FY 2017, the mental health program at Larned was moved to El Dorado. This allowed LCMHF to double bunk and increase Central Unit capacity from 150 to 300. In addition, this move allowed KDOC to increase mental health beds from 150 to 190 and have access to a larger recruiting pool for mental health staff. At the onset of the COVID-19 pandemic, KDOC reopened the former Larned Juvenile Correctional Facility for use as an intake isolation unit. Redesignated LCMHF - South Unit, new male admissions were housed in this unit for a two-week quarantine before moving on to the reception and diagnostic unit at El Dorado. Later, this unit was used to house older residents at risk of COVID-19 complications that were previously house in an open dorm setting. In 2021, the West Unit population was moved to the South Unit. This allowed KDOC to take advantage of the more efficient designed that required fewer staff as well as the improved ventilation systems. On July 1, 2021, KDOC's contract food service provider took over the food service operation at LCMHF. The lower cost per meal under the KDOC contract generated an estimated net savings of $2.1 million in savings to the state and improved efficiencies at both LCMHF and LSH.
Consequences of Not Funding this ProgramThis program includes Classification and Records and various support functions. Classification and Records are responsible for the reporting and recording of all pertinent information regarding the movement and progress of residents at the facility, to included establishment of legal authority to incarcerate, movement, behavior, progress, disciplinary history, and program participation. Under the coordination of the unit teams, an individualized treatment program is developed, implemented, and maintained for each resident. Each resident, as well as facility staff, is kept aware of the resident's status within the correctional process. This program provides direct case management to the inmates, holding them accountable for their behavior, while identifying and localizing problems within each unit. Also include in this program are chaplain services, library services, and recreation. Not funding this program would eliminate the processes and activities that are critical to appropriate placement, documentation, and treatment plan development and implementation. Program GoalsA. To provide effective caseload management from reception to release of offenders from confinement. Performance Measures
SecurityProgram HistoryThe Larned Correctional Mental Health Facility (LCMHF) was built in response to an April 1989 federal court order, which directed that the State develop and implement an acceptable long-term plan for the mentally ill, protective custody, and high-security offenders. Construction of the 150- bed facility began on the grounds of the Larned State Hospital (LSH) in January 1991, and the facility was dedicated in December of that same year. The facility was designed with a shared services concept in mind. Under this concept, Larned State Hospital would provide food service, laundry, and warehouse function for the correctional facility. As such, the new facility was designed with minimal warehouse, kitchen, and support services space. In 1996, the Department entered into a lease with the LSH to utilize a vacant building for housing minimum-security residents. This unit was designated the LCMHF -West Unit. Most residents housed in the West Unit were assigned to work details at LCMHF or LSH, though some residents were assigned to private industry jobs. These jobs allow residents to begin saving and preparing for eventual release and to begin paying for such expenses as room and board, transportation, court costs, fines, restitution, child support and taxes while they are still incarcerated. During FY 2017, the mental health program at Larned was moved to El Dorado. This allowed LCMHF to double bunk and increase Central Unit capacity from 150 to 300. In addition, this move allowed KDOC to increase mental health beds from 150 to 190 and have access to a larger recruiting pool for mental health staff. At the onset of the COVID-19 pandemic, KDOC reopened the former Larned Juvenile Correctional Facility for use as an intake isolation unit. Redesignated LCMHF - South Unit, new male admissions were housed in this unit for a two-week quarantine before moving on to the reception and diagnostic unit at El Dorado. Later, this unit was used to house older residents at risk of COVID-19 complications that were previously house in an open dorm setting. In 2021, the West Unit population was moved to the South Unit. This allowed KDOC to take advantage of the more efficient designed that required fewer staff as well as the improved ventilation systems. On July 1, 2021, KDOC's contract food service provider took over the food service operation at LCMHF. The lower cost per meal under the KDOC contract generated an estimated net savings of $2.1 million in savings to the state and improved efficiencies at both LCMHF and LSH.
Consequences of Not Funding this ProgramThe Security program include salaries and wages for all uniformed security officers and operating expenses, such as clothing, drug testing, and security equipment. This program is essential to operating the facility. Program GoalsA. To maintain an effective posture of physical/perimeter security as measured by the KDOC Security Inspection and accreditation audits. B. To effectively control unsanctioned prison groups in the prison population through proper identification, tracking, intelligence gathering techniques, and management strategies. C. To maintain a safe environment for incarcerated offenders. Performance Measures
Support ServicesProgram HistoryThe Larned Correctional Mental Health Facility (LCMHF) was built in response to an April 1989 federal court order, which directed that the State develop and implement an acceptable long-term plan for the mentally ill, protective custody, and high-security offenders. Construction of the 150- bed facility began on the grounds of the Larned State Hospital (LSH) in January 1991, and the facility was dedicated in December of that same year. The facility was designed with a shared services concept in mind. Under this concept, Larned State Hospital would provide food service, laundry, and warehouse function for the correctional facility. As such, the new facility was designed with minimal warehouse, kitchen, and support services space. In 1996, the Department entered into a lease with the LSH to utilize a vacant building for housing minimum-security residents. This unit was designated the LCMHF -West Unit. Most residents housed in the West Unit were assigned to work details at LCMHF or LSH, though some residents were assigned to private industry jobs. These jobs allow residents to begin saving and preparing for eventual release and to begin paying for such expenses as room and board, transportation, court costs, fines, restitution, child support and taxes while they are still incarcerated. During FY 2017, the mental health program at Larned was moved to El Dorado. This allowed LCMHF to double bunk and increase Central Unit capacity from 150 to 300. In addition, this move allowed KDOC to increase mental health beds from 150 to 190 and have access to a larger recruiting pool for mental health staff. At the onset of the COVID-19 pandemic, KDOC reopened the former Larned Juvenile Correctional Facility for use as an intake isolation unit. Redesignated LCMHF - South Unit, new male admissions were housed in this unit for a two-week quarantine before moving on to the reception and diagnostic unit at El Dorado. Later, this unit was used to house older residents at risk of COVID-19 complications that were previously house in an open dorm setting. In 2021, the West Unit population was moved to the South Unit. This allowed KDOC to take advantage of the more efficient designed that required fewer staff as well as the improved ventilation systems. On July 1, 2021, KDOC's contract food service provider took over the food service operation at LCMHF. The lower cost per meal under the KDOC contract generated an estimated net savings of $2.1 million in savings to the state and improved efficiencies at both LCMHF and LSH.
Consequences of Not Funding this ProgramFunctions included in this program consist of maintenance, laundry, warehouse operations. Also included in this program are utility expenditures. Not funding the support services program would eliminate funding necessary for the operation and maintenance of the facility. Norton Correctional FacilityAdministrationProgram HistoryThe Norton Correctional Facility was originally the Norton Tuberculosis Hospital, which received its first patient in 1915. By 1963, the need for tuberculosis treatment beds had declined while the need for more hospital beds for the care of the intellectually disabled increased. For five years the institution served both tuberculosis and intellectually disabled patients. In 1967 the institution was renamed the Norton State Hospital and the mission transitioned solely to the treatment of the intellectually disabled. The transition to smaller, community-based settings for this population in the 1980s and the need for more prison beds led to the decision transfer the institution to the Kansas Department of Corrections in 1987. The 1987 Legislature also authorized the acquisition of a farm implement dealership in Stockton for use as a minimum-security facility. The Stockton Correctional Facility received its first residents in 1988. In 1990, Stockton was administratively consolidated with Norton and renamed the Norton Correctional Facility - East Unit. In 1997, a new medium-security housing unit was constructed at the Norton Correctional Facility - Central Unit. Budgetary constraints in 2009 led to the suspension of East Unit operations. On September 1, 2010 the East Unit was re-opened.
Consequences of Not Funding this ProgramThe Administration program provides for the overall management and operational control of the facility. This program includes the warden, human resources, mailroom, policy and compliance, staff development, and fiscal. Not funding this program would eliminate the leadership and support functions necessary to operate the facility. Program GoalsA. Operate and maintain a personnel system in accordance with state and departmental regulations, ensuring that positions are classified appropriately and that vacant positions are filled in a timely manner. B. Operate programs for existing and new employees that provide the training required by state law and departmental regulations. Performance Measures
Capital Improvements
Consequences of Not Funding this ProgramThe capital improvement program is used solely for budgeting and recording expenditures related to rehabilitation and repair projects. KDOC central office is appropriated $4,920,000 from the Correctional Institutions Building Fund annually for rehabilitation and repair projects throughout the KDOC system. Funds are transferred to the facility as projects are approved. Eliminating this program would prohibit the Department from making repairs, upgrades, and improvements to the facilities. Classification & ProgramsProgram HistoryThe Norton Correctional Facility was originally the Norton Tuberculosis Hospital, which received its first patient in 1915. By 1963, the need for tuberculosis treatment beds had declined while the need for more hospital beds for the care of the intellectually disabled increased. For five years the institution served both tuberculosis and intellectually disabled patients. In 1967 the institution was renamed the Norton State Hospital and the mission transitioned solely to the treatment of the intellectually disabled. The transition to smaller, community-based settings for this population in the 1980s and the need for more prison beds led to the decision transfer the institution to the Kansas Department of Corrections in 1987. The 1987 Legislature also authorized the acquisition of a farm implement dealership in Stockton for use as a minimum-security facility. The Stockton Correctional Facility received its first residents in 1988. In 1990, Stockton was administratively consolidated with Norton and renamed the Norton Correctional Facility - East Unit. In 1997, a new medium-security housing unit was constructed at the Norton Correctional Facility - Central Unit. Budgetary constraints in 2009 led to the suspension of East Unit operations. On September 1, 2010 the East Unit was re-opened.
Consequences of Not Funding this ProgramThis program includes Classification and Records and various support functions. Classification and Records are responsible for the reporting and recording of all pertinent information regarding the movement and progress of residents at the facility, to included establishment of legal authority to incarcerate, movement, behavior, progress, disciplinary history, and program participation. Under the coordination of the unit teams, an individualized treatment program is developed, implemented, and maintained for each resident. Each resident, as well as facility staff, is kept aware of the resident's status within the correctional process. This program provides direct case management to the inmates, holding them accountable for their behavior, while identifying and localizing problems within each unit. Also include in this program are chaplain services, library services, and recreation. Not funding this program would eliminate the processes and activities that are critical to appropriate placement, documentation, and treatment plan development and implementation. Program GoalsA. To provide effective caseload management from reception to release of offenders from confinement. Performance Measures
East UnitProgram HistoryThe 1987 Legislature authorized the acquisition of a farm implement dealership in Stockton for use as a minimum-security facility. The Stockton Correctional Facility received its first residents in 1988. In 1990, Stockton was administratively consolidated with Norton and renamed the Norton Correctional Facility - East Unit. Budgetary constraints in 2009 led to the suspension of East Unit operations. On September 1, 2010 the East Unit was re-opened.
Consequences of Not Funding this ProgramAll expenditures for the East Unit, located in Stockton, are recorded separately from expenses related to the operation of the Central Unit. Included in this program are the salaries and wages for unit staff, unit administrator, support staff, unit team, and maintenance staff, as well as utilities, clothing, and other operating expenditures. Not funding for this program would result it the unit's closure. Program GoalsA. To provide effective caseload management from reception to release of offenders from confinement. SecurityProgram HistoryThe Norton Correctional Facility was originally the Norton Tuberculosis Hospital, which received its first patient in 1915. By 1963, the need for tuberculosis treatment beds had declined while the need for more hospital beds for the care of the intellectually disabled increased. For five years the institution served both tuberculosis and intellectually disabled patients. In 1967 the institution was renamed the Norton State Hospital and the mission transitioned solely to the treatment of the intellectually disabled. The transition to smaller, community-based settings for this population in the 1980s and the need for more prison beds led to the decision transfer the institution to the Kansas Department of Corrections in 1987. The 1987 Legislature also authorized the acquisition of a farm implement dealership in Stockton for use as a minimum-security facility. The Stockton Correctional Facility received its first residents in 1988. In 1990, Stockton was administratively consolidated with Norton and renamed the Norton Correctional Facility - East Unit. In 1997, a new medium-security housing unit was constructed at the Norton Correctional Facility - Central Unit. Budgetary constraints in 2009 led to the suspension of East Unit operations. On September 1, 2010 the East Unit was re-opened.
Consequences of Not Funding this ProgramThe Security program include salaries and wages for all uniformed security officers and operating expenses, such as clothing, drug testing, and security equipment. This program is essential to operating the facility. Program GoalsA. To maintain an effective posture of physical/perimeter security as measured by the KDOC Security Inspection and accreditation audits. B. To effectively control unsanctioned prison groups in the prison population through proper identification, tracking, intelligence gathering techniques, and management strategies. C. To maintain a safe environment for incarcerated offenders. Performance Measures
Support Services
Consequences of Not Funding this ProgramFunctions included in this program consist of maintenance, laundry, warehouse operations. Also included in this program are utility expenditures. Not funding the support services program would eliminate funding necessary for the operation and maintenance of the facility. TransportationProgram HistoryThe Transportation Unit began operation in March 1989 to provide for the orderly and secure movement of inmates utilizing a regularly scheduled program of transportation, while employing needed security measures to prevent escape and ensure the safety of escort personnel and the public. The unit was originally divided into two hub operations; one hub was located at the Lansing Correctional Facility and the other at the Hutchinson Correctional Facility. Early in 1998, a third hub was established at Norton Correctional Facility.
Consequences of Not Funding this ProgramTransportation between correctional facilities, to and from other jurisdictions in the state, and out-of-state is coordinated through Central Transportation Coordinator at the Hutchinson Correctional Facility. Transportation hubs are also located at the Lansing and Norton Correctional Facilities. Elimination of this program would result in a decentralized system operated by individual facilities. Program GoalsA. To provide for the safe and secure transportation of inmates during inter-facility transfers and of those inmates being returned for parole violations. Performance Measures
Sentencing CommissionResearch, Statistical Analysis, and AdministrationProgram HistorySenate Bill 50, which became law in 1989, established the Kansas Sentencing Commission, and directed the Commission to: "Develop a sentencing guidelines model or grid based on fairness and equity and...provide a mechanism for linking justice and corrections policies. The sentencing guideline model or grid shall establish rational and consistent sentencing standards which reduce sentence disparity, to include, but not be limited to, racial and regional biases which may exist under current sentencing practices." (See L. 1989, Ch. 225, Sec. 1)After it was fully formed and staffed by November, 1989, the Commission met semi-monthly in Topeka. The Commission decided early on to confine their activities to adult felony sentences. Further, the Commission identified a set of goals to be attained in developing a uniform sentencing guidelines system:1. To develop a set of guidelines that promote public safety by incarcerating violent offenders;2. To reduce sentence disparity to ensure the elimination of any racial, geographical or other bias that may exist;3. To establish sentences that are proportional to the seriousness of the offense and the degree of injury to the victim;4. To establish a range of easy to understand presumptive sentences that will promote "truth in sentencing". To provide state and local correctional authorities with information to assist with population management options and program coordination;6. To provide policy makers information that will enhance decisions regarding resource allocations. The Sentencing Commission considered a wide range of topics relevant to sentencing guidelines, reviewed information from other states' guidelines (primarily Minnesota, Washington, Oregon and California), heard testimony from local and national criminal justice professionals, and visited several correctional facilities. In addition, the Commission conducted a comprehensive study of existing sentencing practices. The study documented a history of racial and geographical bias in sentencing, attributable to a system which, because it directed decision makers to consider socio-economic factors in sentencing, reflected general societal inequities. The Sentencing Commission submitted its recommendations at the commencement of the 1991 legislative session, as was required under L. 1989, Ch. 225, Sec. 4. The Commission recommended a presumptive sentencing system, represented by sentencing grids for both non-drug and drug offenses, that provides an appropriate sentence for a crime based upon the crime of conviction and the individual's past criminal history. It further recommended that the sentencing court be allowed to depart from the presumptive sentence provided that the court explain on the record the reasons for a departure, and that a decision to depart be subject to appeal. The Commission recommended that statutory enactments and amendments to implement a sentencing guidelines system become effective on July 1, 1992.
Consequences of Not Funding this ProgramThe Sentencing Commission is statutorily mandated to maintain the Kansas Sentencing Guidelines. Monthly, the Commission meets to determine ways to reform efforts in sentencing to be equitable and just. This requires a data-driven approach rather than an anecdotal one. The KSSC serves as the state statistical analysis center for Kansas. State agencies such as KBI, KDOC, OJA provide their data to the KSSC for analysis. The KSSC also collects sentencing data for all felonies committed in the state. This enables stakeholders (governor, legislature, KDOC, and others) to make informed policy decisions based on data and not emotions. Sentencing disparities and disproportional sentencing will occur if not funded. Program GoalsA. To develop and maintain a monitoring system that allows for comprehensive evaluation of the sentencing guidelines. B. To forecast the state's adult and juvenile offender populations incarcerated in state institutions, and to determine the impact of proposed legislation on the prison population. C. To assist in the process of educating and training judges, attorneys, court services officers, state parole officers, correctional officers, law enforcement officials and other criminal justice groups in the understanding and application of sentencing guidelines. D. To serve as an information resource for the legislature and various state criminal justice agencies. Performance Measures
SB 123 Substance Abuse Treatment ProgramProgram HistoryKSA 21-6824 (commonly referred to as the SB 123 substance abuse treatment program) was created during the 2003 legislative session. Under community corrections supervision, SB 123 provides certified substance abuse treatment for offenders convicted of K.S.A 21-5706 (drug possession) and a limited number of those convicted of KSA 21-5705 (drug severity level 4, small distribution). Those receiving state-paid substance abuse treatment are nonviolent adult offenders with no prior convictions of drug trafficking, drug manufacturing or drug possession with intent to distribute. In 2021, the Recovery from Addiction For Treatment (RAFT) diversion program was passed to allow for drug possession divertees to received state-paid treatment. The Kansas Sentencing Commission administers this and the SB 123 program by providing administration, monitoring, evaluation, payment services, publications, and informational trainings. The KSSC pays a network of 140 certified substance abuse treatment providers to adminster inpatient and outpatient treatment to the offenders after they have been ordered into treatment by district courts.
Consequences of Not Funding this ProgramSince 2003, the Kansas Sentencing Commission has administered the SB 123 substance abuse treatment program. This community-based program keeps certain controlled substance offenders in the community for treatment, where it is most effective. The program funds a continuum of care from inpatient to family outpatient treatment. One of the highest costs to taxpayers in the criminal justice system is incarcerating its citizens. SB 123 provides up to 18 months of state-paid treatment to keep offenders in the community and out of prison. Increased incarceration of nonviolent offenders with substance abuse disorders will result in higher costs to the state. According to KDOC's FY 2020 Annual Report, the average annual cost to incarcerate one offender is $35,040. The SB 123 program provides community-based treatment at substantial cost savings to taxpayers of $2,943/year/offender. Program GoalsA. Provide substance abuse treatment and supervision within Kansas communities for offenders with substance abuse addictions and improve local communities by reducing recidivism. B. Provide a responsive centralized system that brings cohesion to the management of the program and efficient payment policies. C. Track financial records of payments through the system and provide analysis and estimates of funding needs. Performance Measures
State Fire MarshalEmergency Response: Hazardous MaterialsProgram HistoryThe Hazardous Materials Response Program has the responsibility to ensure all hazardous materials, weapons of mass destruction, toxic industrial chemicals, and radiological spills, releases, fires and/or explosions are handled quickly and safely with minimal exposure to the citizens of Kansas and minimal threat to lives and property. The expectations of the program have increased since the program's inception, primarily due to events of September 11, 2001. Additional response and training required by the memorandum of understanding with the Kansas Department of Health & Environment (KDHE), the Division of Emergency Management (KDEM) for response to Wolf Creek accidents/incidents, in addition to the requirements of the Biological Research Institute (BRI), and the National Bio and Agro-Defense Facility (NBAF) in Manhattan have contributed to the expanded role of the program.
Consequences of Not Funding this ProgramStatutory mandate would not be met. Program GoalsA. Maintain the technician level competencies of each of the 9 regional hazmat response teams. B. Provide refresher training for each regional team associated with the hazardous materials response program. C. Provide technician courses and specialized training in additional areas of expertise to maintain a cadre of qualified team members. Performance Measures
Emergency Response: Search and RescueProgram HistoryThe Search and Rescue Program is a relatively new program for OSFM that began in FY 2016. The legislation gives the state fire marshal authority to enter into contracts to establish regional search and rescue teams to provide a response to search and rescue incidents. The program provides a coordinated response to man-made and/or natural disasters; bringing relief to affected communities by providing search and rescue, medical support, damage assessment and other humanitarian assistance throughout the state of Kansas. When called upon and approved to do so, these regional teams can and will also deploy outside of the state's jurisdiction to provide these same services across the nation.
Consequences of Not Funding this ProgramStatutory mandate would not be met. Program GoalsA. Provide refresher training for each task force associated with the program. B. Provide position specific courses to maintain qualified task force members. C. Provide specialized training in additional areas of expertise. Performance Measures
Investigations: FireProgram HistoryArson is one of the hardest crimes to convict. The national conviction rate for arson is 3%. The State Fire Marshal's program consistently maintains an average conviction rate between 10% and 14% annually. In many arson cases other crimes are present such as murder, burglary, insurance fraud, thefts, domestic disputes, and illicit drug manufacturing. Explosives or incendiary weapons are used in 92% of all mass casualty or terrorist (domestic or international) crimes. The Division provides thorough, effective, efficient, and reliable investigation of any fire, explosion or attempt to cause a fire and/or explosion that occurred within the state. All state fire marshal's investigators are state certified law enforcement officers and they hold an assortment of certifications centered around the investigation of fires and explosions/blasts. The Accelerant Detection Canines (ADC) also hold nationally recognized certifications.
Consequences of Not Funding this ProgramStatutory mandate would not be met. Program GoalsA. Of cases investigated by State Fire Marshal, desire a reduction of 10% of total incendiary fires and explosions in Kansas. B. Increase the total number of persons arrested/convicted of arson and other related crimes. C. Maintain an above "national standard" arson conviction/clearance percentage due to dedicated specialized investigative skilled personnel for fire/explosive investigations. Performance Measures
Investigations: Fire Safe CigaretteProgram HistoryProgram provides for the oversight of Fire Safe Cigarettes and the enforcement/compliance of the statutes and regulations. All cigarettes that are sold in the State of Kansas must be certified and approved as limited ignition cigarettes. FY 2014 began the fourth full registration and certification process for the program and the first year for renewals. In FY 2015 the certification process continued, and we began the random testing of brands to ensure the paper meets the standards set out in KSA 31-603.
Consequences of Not Funding this ProgramStatutory mandate would not be met. Program GoalsA. Reduce the number of fires caused by cigarette misuse. B. Increase compliance/reduce violations by cigarette vendors. C. Increase cigarette accountability. Performance Measures
Prevention: Boiler SafetyProgram HistoryThe Boiler Safety Program was transferred to the State Fire Marshal from the Secretary of Labor by the 2013 Legislature. Inspections of boiler units in operation in Kansas are completed to ensure safety requirements are met according to the codes and laws. The agency also inspects all new installations of boilers and unfired pressure vessels in Kansas. Inspection requirements vary by vessel type, some are on a three-year cycle, some are annual, and some are done twice a year. The Office of the State Fire Marshal partners with insurance companies, receiving inspection reports for issuing boiler certifications.
Consequences of Not Funding this ProgramStatutory mandate would not be met. Program GoalsA. Locate and inspect all boilers and pressure vessels; issue certificates. B. Identify hazards and code violations, enforce corrections, repairs and/or replacement units. C. Review inspection reports of partner companies ensuring compliance of regulations and codes. Performance Measures
Prevention: Elevator SafetyProgram History2022 HB 2005, section 2 through 21, establishes the Elevator Safety Act and the duties of the state fire marshal in relation to safety standards for elevators and licensure requirements for elevator inspection, installation, and repair.
Consequences of Not Funding this ProgramStatutory mandate would not be met. Program GoalsA. Locate all elevators; issue annual certificates. B. Identify hazards and code violations, enforce corrections, repairs and/or replacement of units. C. Review inspection reports, ensuring compliance of regulations and codes. Performance Measures
Prevention: Plans Review, Inspections, & EnforcementProgram HistoryThe fire prevention program reduces the potential impact of fire and explosion hazards where people live, work, and congregate through fire and life safety inspection, code enforcement and public education. The program aids in the reduction of deaths, injuries and property losses that result from fire, explosion, and hazardous materials incidents.
Consequences of Not Funding this ProgramStatutory mandate would not be met. Program GoalsA. Inspection and plans review emphasis on priority occupancies; schools, colleges, universities, nursing homes, hospitals, childcare facilities, hotels/motels and as well as jail and corrections institutions. These occupancies have populations at greatest risk (children, senior citizens, mentally or physically challenged, hospitalized and the incarcerated). B. Inspection and plans review of facilities where larger numbers of people congregate such as restaurants, assembly areas and multiple family residential buildings. C. Prioritize inspections and compliance of flammables and combustible fuels due to the potential health and safety dangers they pose to Kansans and the environment. These facilities are considered a security risk as they are recognized as targets for terrorism. Performance Measures
Topeka Correctional FacilityAdministrationProgram HistoryIn 1961 the Kansas Legislature authorized the Director of Penal Institutions to convert facilities of the Kansas Technical Institute into a State Reception and Diagnostic Center (SRDC). The primary function of the facility was to perform evaluations on convicted offenders sentenced to the Kansas State Penitentiary and the Kansas State Industrial Reformatory. Offender work crews from the Penitentiary performed the renovation and the first residents were received in early 1962. Legislation in 1971 established the Kansas Correctional-Vocational Training Center (KCVTC). The targeted population was non-violent, youthful, first-time male offenders. KCVTC was built next to the SRDC and began to receive residents on January 2, 1975. KCVTC began housing female residents alongside the male population in 1979 to relieve the overcrowding at the Kansas Correctional Institution for Women at Lansing and to provide non-traditional vocational training opportunities to the female population. Legislation in 1984 established the Topeka Pre-Release Center on the grounds of the Topeka State Hospital. The purpose of this program was to provide male and female residents with a smoother transition from prison to the community. The Pre-Release Center operated until 1988 when it transitioned to a work-oriented facility for minimum custody male residents, and later female residents, under the name Topeka Correctional Facility. A work release program was then added at the Forbes Industrial Area, where it operated as the Forbes Correctional Facility. Consolidation of the four separate operations in Topeka began with the passage of Senate Bill 748 in 1990. Initially, SRDC and KCVTC became the Topeka Correctional Facility-East and the Topeka Correctional Facility and Forbes Correctional Facility became known at the Topeka Correctional Facility-West. In 1991 these two operations were further consolidated under a single administration designated as the Topeka Correctional Facility. In 1994 the work release unit at Forbes closed. In 1995, construction of I-Cell House was completed and the maximum-security female population at Lansing was relocated to Topeka. In 2001, the last of the male population departed TCF when the reception and diagnostic unit was relocated to El Dorado. In 2002 the unit on the former State Hospital grounds was close and the staff reassigned to the newly remodeled J-Cellhouse, bringing all TCF operations within the complex that exists today.
Consequences of Not Funding this ProgramThe Administration program provides for the overall management and operational control of the facility. This program includes the warden, human resources, mailroom, policy and compliance, staff development, and fiscal. Not funding this program would eliminate the leadership and support functions necessary to operate the facility. Program GoalsA. Operate and maintain a personnel system in accordance with state and departmental regulations, ensuring that positions are classified appropriately and that vacant positions are filled in a timely manner. B. Operate programs for existing and new employees that provide the training required by state law and departmental regulations. Performance Measures
Capital Improvements
Consequences of Not Funding this ProgramThe capital improvement program is used solely for budgeting and recording expenditures related to rehabilitation and repair projects. KDOC central office is appropriated $4,920,000 from the Correctional Institutions Building Fund annually for rehabilitation and repair projects throughout the KDOC system. Funds are transferred to the facility as projects are approved. Eliminating this program would prohibit the Department from making repairs, upgrades, and improvements to the facilities. Classification & ProgramsProgram HistoryIn 1961 the Kansas Legislature authorized the Director of Penal Institutions to convert facilities of the Kansas Technical Institute into a State Reception and Diagnostic Center (SRDC). The primary function of the facility was to perform evaluations on convicted offenders sentenced to the Kansas State Penitentiary and the Kansas State Industrial Reformatory. Offender work crews from the Penitentiary performed the renovation and the first residents were received in early 1962. Legislation in 1971 established the Kansas Correctional-Vocational Training Center (KCVTC). The targeted population was non-violent, youthful, first-time male offenders. KCVTC was built next to the SRDC and began to receive residents on January 2, 1975. KCVTC began housing female residents alongside the male population in 1979 to relieve the overcrowding at the Kansas Correctional Institution for Women at Lansing and to provide non-traditional vocational training opportunities to the female population. Legislation in 1984 established the Topeka Pre-Release Center on the grounds of the Topeka State Hospital. The purpose of this program was to provide male and female residents with a smoother transition from prison to the community. The Pre-Release Center operated until 1988 when it transitioned to a work-oriented facility for minimum custody male residents, and later female residents, under the name Topeka Correctional Facility. A work release program was then added at the Forbes Industrial Area, where it operated as the Forbes Correctional Facility. Consolidation of the four separate operations in Topeka began with the passage of Senate Bill 748 in 1990. Initially, SRDC and KCVTC became the Topeka Correctional Facility-East and the Topeka Correctional Facility and Forbes Correctional Facility became known at the Topeka Correctional Facility-West. In 1991 these two operations were further consolidated under a single administration designated as the Topeka Correctional Facility. In 1994 the work release unit at Forbes closed. In 1995, construction of I-Cell House was completed and the maximum-security female population at Lansing was relocated to Topeka. In 2001, the last of the male population departed TCF when the reception and diagnostic unit was relocated to El Dorado. In 2002 the unit on the former State Hospital grounds was close and the staff reassigned to the newly remodeled J-Cellhouse, bringing all TCF operations within the complex that exists today.
Consequences of Not Funding this ProgramThis program includes Classification and Records and various support functions. Classification and Records are responsible for the reporting and recording of all pertinent information regarding the movement and progress of residents at the facility, to included establishment of legal authority to incarcerate, movement, behavior, progress, disciplinary history, and program participation. Under the coordination of the unit teams, an individualized treatment program is developed, implemented, and maintained for each resident. Each resident, as well as facility staff, is kept aware of the resident's status within the correctional process. This program provides direct case management to the inmates, holding them accountable for their behavior, while identifying and localizing problems within each unit. Also include in this program are chaplain services, library services, and recreation. Not funding this program would eliminate the processes and activities that are critical to appropriate placement, documentation, and treatment plan development and implementation. Program GoalsA. To provide effective caseload management from reception to release of offenders from confinement. Performance Measures
SecurityProgram HistoryIn 1961 the Kansas Legislature authorized the Director of Penal Institutions to convert facilities of the Kansas Technical Institute into a State Reception and Diagnostic Center (SRDC). The primary function of the facility was to perform evaluations on convicted offenders sentenced to the Kansas State Penitentiary and the Kansas State Industrial Reformatory. Offender work crews from the Penitentiary performed the renovation and the first residents were received in early 1962. Legislation in 1971 established the Kansas Correctional-Vocational Training Center (KCVTC). The targeted population was non-violent, youthful, first-time male offenders. KCVTC was built next to the SRDC and began to receive residents on January 2, 1975. KCVTC began housing female residents alongside the male population in 1979 to relieve the overcrowding at the Kansas Correctional Institution for Women at Lansing and to provide non-traditional vocational training opportunities to the female population. Legislation in 1984 established the Topeka Pre-Release Center on the grounds of the Topeka State Hospital. The purpose of this program was to provide male and female residents with a smoother transition from prison to the community. The Pre-Release Center operated until 1988 when it transitioned to a work-oriented facility for minimum custody male residents, and later female residents, under the name Topeka Correctional Facility. A work release program was then added at the Forbes Industrial Area, where it operated as the Forbes Correctional Facility. Consolidation of the four separate operations in Topeka began with the passage of Senate Bill 748 in 1990. Initially, SRDC and KCVTC became the Topeka Correctional Facility-East and the Topeka Correctional Facility and Forbes Correctional Facility became known at the Topeka Correctional Facility-West. In 1991 these two operations were further consolidated under a single administration designated as the Topeka Correctional Facility. In 1994 the work release unit at Forbes closed. In 1995, construction of I-Cell House was completed and the maximum-security female population at Lansing was relocated to Topeka. In 2001, the last of the male population departed TCF when the reception and diagnostic unit was relocated to El Dorado. In 2002 the unit on the former State Hospital grounds was close and the staff reassigned to the newly remodeled J-Cellhouse, bringing all TCF operations within the complex that exists today.
Consequences of Not Funding this ProgramThe Security program include salaries and wages for all uniformed security officers and operating expenses, such as clothing, drug testing, and security equipment. This program is essential to operating the facility. Program GoalsA. To maintain an effective posture of physical/perimeter security as measured by the KDOC Security Inspection and accreditation audits. B. To effectively control unsanctioned prison groups in the prison population through proper identification, tracking, intelligence gathering techniques, and management strategies. C. To maintain a safe environment for incarcerated offenders. Performance Measures
Support ServicesProgram HistoryIn 1961 the Kansas Legislature authorized the Director of Penal Institutions to convert facilities of the Kansas Technical Institute into a State Reception and Diagnostic Center (SRDC). The primary function of the facility was to perform evaluations on convicted offenders sentenced to the Kansas State Penitentiary and the Kansas State Industrial Reformatory. Offender work crews from the Penitentiary performed the renovation and the first residents were received in early 1962. Legislation in 1971 established the Kansas Correctional-Vocational Training Center (KCVTC). The targeted population was non-violent, youthful, first-time male offenders. KCVTC was built next to the SRDC and began to receive residents on January 2, 1975. KCVTC began housing female residents alongside the male population in 1979 to relieve the overcrowding at the Kansas Correctional Institution for Women at Lansing and to provide non-traditional vocational training opportunities to the female population. Legislation in 1984 established the Topeka Pre-Release Center on the grounds of the Topeka State Hospital. The purpose of this program was to provide male and female residents with a smoother transition from prison to the community. The Pre-Release Center operated until 1988 when it transitioned to a work-oriented facility for minimum custody male residents, and later female residents, under the name Topeka Correctional Facility. A work release program was then added at the Forbes Industrial Area, where it operated as the Forbes Correctional Facility. Consolidation of the four separate operations in Topeka began with the passage of Senate Bill 748 in 1990. Initially, SRDC and KCVTC became the Topeka Correctional Facility-East and the Topeka Correctional Facility and Forbes Correctional Facility became known at the Topeka Correctional Facility-West. In 1991 these two operations were further consolidated under a single administration designated as the Topeka Correctional Facility. In 1994 the work release unit at Forbes closed. In 1995, construction of I-Cell House was completed and the maximum-security female population at Lansing was relocated to Topeka. In 2001, the last of the male population departed TCF when the reception and diagnostic unit was relocated to El Dorado. In 2002 the unit on the former State Hospital grounds was close and the staff reassigned to the newly remodeled J-Cellhouse, bringing all TCF operations within the complex that exists today.
Consequences of Not Funding this ProgramFunctions included in this program consist of maintenance, laundry, warehouse operations. Also included in this program are utility expenditures. Not funding the support services program would eliminate funding necessary for the operation and maintenance of the facility. Winfield Correctional FacilityAdministrationProgram HistoryThe Winfield Correctional Facility was established in 1984 by SB 496 as the Winfield Pre-Release Center on the grounds of the Winfield State Hospital and Training Center (WSH&TC). In 1987, funds were appropriated to expand capacity and in 1989 the name was changed to the Winfield Correctional Facility. As the need for more prison beds grew, funds were appropriated in 1995 and 1998 to renovate vacant WSH&TC housing units. On July 1, 1997, WCF assumed operations of the maintenance shop, laundry, and warehouse formerly operated by WSH&TC. WCF also assumed the responsibility of maintaining the security of the entire complex. Following the recommendations of the Hospital Closure Commission, WSH&TC was closed during FY 1998. In 1999 the ownership of the property was split between and the Kansas Veterans Commission. The Kansas Veteran's Home (KVH) opened in February 2000. WCF provides laundry services, grounds maintenance, trash removal, perimeter and grounds security, warehouse space and maintenance shop services. WCF also pays electricity, natural gas, water, and solid waste utilities for KVH. On July 1, 2020, Triplett and Funston Halls were transferred from KVH to WCF. These units will be used as an assisted living and acute care unit and substance abuse program unit. Renovations are expected to be completed during FY 2021 and the units occupied in FY 2022. In 1976 the Wichita Work Release Facility (WWRF) was established as a separate facility in accordance with the 1974 Penal Reform Act, which required the establishment of work release programs designed to provide residents with an opportunity to develop work skills and secure employment prior to release. Originally consisting of 22 mixed-gender beds near Wichita State University, WWRF relocated and expanded capacity in 1978 and again in 1989. The 1990 Legislature appropriated funds to purchase and renovate a building in downtown Wichita, where WWRF is located today. In 1996, WWRF was administratively consolidated with WCF. In 2002, the female population was transferred to the Topeka Correctional Facility.
Consequences of Not Funding this ProgramThe Administration program provides for the overall management and operational control of the facility. This program includes the warden, human resources, mailroom, policy and compliance, staff development, and fiscal. Not funding this program would eliminate the leadership and support functions necessary to operate the facility. Program GoalsA. Operate and maintain a personnel system in accordance with state and departmental regulations, ensuring that positions are classified appropriately and that vacant positions are filled in a timely manner. B. Operate programs for existing and new employees that provide the training required by state law and departmental regulations. Performance Measures
Capital Improvements
Consequences of Not Funding this ProgramThe capital improvement program is used solely for budgeting and recording expenditures related to rehabilitation and repair projects. KDOC central office is appropriated $4,920,000 from the Correctional Institutions Building Fund annually for rehabilitation and repair projects throughout the KDOC system. Funds are transferred to the facility as projects are approved. Eliminating this program would prohibit the Department from making repairs, upgrades, and improvements to the facilities. Classification & ProgramsProgram HistoryThe Winfield Correctional Facility was established in 1984 by SB 496 as the Winfield Pre-Release Center on the grounds of the Winfield State Hospital and Training Center (WSH&TC). In 1987, funds were appropriated to expand capacity and in 1989 the name was changed to the Winfield Correctional Facility. As the need for more prison beds grew, funds were appropriated in 1995 and 1998 to renovate vacant WSH&TC housing units. On July 1, 1997, WCF assumed operations of the maintenance shop, laundry, and warehouse formerly operated by WSH&TC. WCF also assumed the responsibility of maintaining the security of the entire complex. Following the recommendations of the Hospital Closure Commission, WSH&TC was closed during FY 1998. In 1999 the ownership of the property was split between and the Kansas Veterans Commission. The Kansas Veteran's Home (KVH) opened in February 2000. WCF provides laundry services, grounds maintenance, trash removal, perimeter and grounds security, warehouse space and maintenance shop services. WCF also pays electricity, natural gas, water, and solid waste utilities for KVH. On July 1, 2020, Triplett and Funston Halls were transferred from KVH to WCF. These units will be used as an assisted living and acute care unit and substance abuse program unit. Renovations are expected to be completed during FY 2021 and the units occupied in FY 2022. In 1976 the Wichita Work Release Facility (WWRF) was established as a separate facility in accordance with the 1974 Penal Reform Act, which required the establishment of work release programs designed to provide residents with an opportunity to develop work skills and secure employment prior to release. Originally consisting of 22 mixed-gender beds near Wichita State University, WWRF relocated and expanded capacity in 1978 and again in 1989. The 1990 Legislature appropriated funds to purchase and renovate a building in downtown Wichita, where WWRF is located today. In 1996, WWRF was administratively consolidated with WCF. In 2002, the female population was transferred to the Topeka Correctional Facility.
Consequences of Not Funding this ProgramThis program includes Classification and Records and various support functions. Classification and Records are responsible for the reporting and recording of all pertinent information regarding the movement and progress of residents at the facility, to included establishment of legal authority to incarcerate, movement, behavior, progress, disciplinary history, and program participation. Under the coordination of the unit teams, an individualized treatment program is developed, implemented, and maintained for each resident. Each resident, as well as facility staff, is kept aware of the resident's status within the correctional process. This program provides direct case management to the inmates, holding them accountable for their behavior, while identifying and localizing problems within each unit. Also include in this program are chaplain services, library services, and recreation. Not funding this program would eliminate the processes and activities that are critical to appropriate placement, documentation, and treatment plan development and implementation. Program GoalsA. To provide effective caseload management from reception to release of offenders from confinement. Performance Measures
SecurityProgram HistoryThe Winfield Correctional Facility was established in 1984 by SB 496 as the Winfield Pre-Release Center on the grounds of the Winfield State Hospital and Training Center (WSH&TC). In 1987, funds were appropriated to expand capacity and in 1989 the name was changed to the Winfield Correctional Facility. As the need for more prison beds grew, funds were appropriated in 1995 and 1998 to renovate vacant WSH&TC housing units. On July 1, 1997, WCF assumed operations of the maintenance shop, laundry, and warehouse formerly operated by WSH&TC. WCF also assumed the responsibility of maintaining the security of the entire complex. Following the recommendations of the Hospital Closure Commission, WSH&TC was closed during FY 1998. In 1999 the ownership of the property was split between and the Kansas Veterans Commission. The Kansas Veteran's Home (KVH) opened in February 2000. WCF provides laundry services, grounds maintenance, trash removal, perimeter and grounds security, warehouse space and maintenance shop services. WCF also pays electricity, natural gas, water, and solid waste utilities for KVH. On July 1, 2020, Triplett and Funston Halls were transferred from KVH to WCF. These units will be used as an assisted living and acute care unit and substance abuse program unit. Renovations are expected to be completed during FY 2021 and the units occupied in FY 2022. In 1976 the Wichita Work Release Facility (WWRF) was established as a separate facility in accordance with the 1974 Penal Reform Act, which required the establishment of work release programs designed to provide residents with an opportunity to develop work skills and secure employment prior to release. Originally consisting of 22 mixed-gender beds near Wichita State University, WWRF relocated and expanded capacity in 1978 and again in 1989. The 1990 Legislature appropriated funds to purchase and renovate a building in downtown Wichita, where WWRF is located today. In 1996, WWRF was administratively consolidated with WCF. In 2002, the female population was transferred to the Topeka Correctional Facility.
Consequences of Not Funding this ProgramThe Security program include salaries and wages for all uniformed security officers and operating expenses, such as clothing, drug testing, and security equipment. This program is essential to operating the facility. Program GoalsA. To maintain an effective posture of physical/perimeter security as measured by the KDOC Security Inspection and accreditation audits. B. To effectively control unsanctioned prison groups in the prison population through proper identification, tracking, intelligence gathering techniques, and management strategies. C. To maintain a safe environment for incarcerated offenders. Performance Measures
Support ServicesProgram HistoryThe Winfield Correctional Facility was established in 1984 by SB 496 as the Winfield Pre-Release Center on the grounds of the Winfield State Hospital and Training Center (WSH&TC). In 1987, funds were appropriated to expand capacity and in 1989 the name was changed to the Winfield Correctional Facility. As the need for more prison beds grew, funds were appropriated in 1995 and 1998 to renovate vacant WSH&TC housing units. On July 1, 1997, WCF assumed operations of the maintenance shop, laundry, and warehouse formerly operated by WSH&TC. WCF also assumed the responsibility of maintaining the security of the entire complex. Following the recommendations of the Hospital Closure Commission, WSH&TC was closed during FY 1998. In 1999 the ownership of the property was split between and the Kansas Veterans Commission. The Kansas Veteran's Home (KVH) opened in February 2000. WCF provides laundry services, grounds maintenance, trash removal, perimeter and grounds security, warehouse space and maintenance shop services. WCF also pays electricity, natural gas, water, and solid waste utilities for KVH. On July 1, 2020, Triplett and Funston Halls were transferred from KVH to WCF. These units will be used as an assisted living and acute care unit and substance abuse program unit. Renovations are expected to be completed during FY 2021 and the units occupied in FY 2022. In 1976 the Wichita Work Release Facility (WWRF) was established as a separate facility in accordance with the 1974 Penal Reform Act, which required the establishment of work release programs designed to provide residents with an opportunity to develop work skills and secure employment prior to release. Originally consisting of 22 mixed-gender beds near Wichita State University, WWRF relocated and expanded capacity in 1978 and again in 1989. The 1990 Legislature appropriated funds to purchase and renovate a building in downtown Wichita, where WWRF is located today. In 1996, WWRF was administratively consolidated with WCF. In 2002, the female population was transferred to the Topeka Correctional Facility.
Consequences of Not Funding this ProgramFunctions included in this program consist of maintenance, laundry, warehouse operations. Also included in this program are utility expenditures. Not funding the support services program would eliminate funding necessary for the operation and maintenance of the facility. Program GoalsA. None; measures are included in administration, security, and classification & programs. Wichita Work Release FacilityProgram HistoryThe Winfield Correctional Facility was established in 1984 by SB 496 as the Winfield Pre-Release Center on the grounds of the Winfield State Hospital and Training Center (WSH&TC). In 1987, funds were appropriated to expand capacity and in 1989 the name was changed to the Winfield Correctional Facility. As the need for more prison beds grew, funds were appropriated in 1995 and 1998 to renovate vacant WSH&TC housing units. On July 1, 1997, WCF assumed operations of the maintenance shop, laundry, and warehouse formerly operated by WSH&TC. WCF also assumed the responsibility of maintaining the security of the entire complex. Following the recommendations of the Hospital Closure Commission, WSH&TC was closed during FY 1998. In 1999 the ownership of the property was split between and the Kansas Veterans Commission. The Kansas Veteran's Home (KVH) opened in February 2000. WCF provides laundry services, grounds maintenance, trash removal, perimeter and grounds security, warehouse space and maintenance shop services. WCF also pays electricity, natural gas, water, and solid waste utilities for KVH. On July 1, 2020, Triplett and Funston Halls were transferred from KVH to WCF. These units will be used as an assisted living and acute care unit and substance abuse program unit. Renovations are expected to be completed during FY 2021 and the units occupied in FY 2022. In 1976 the Wichita Work Release Facility (WWRF) was established as a separate facility in accordance with the 1974 Penal Reform Act, which required the establishment of work release programs designed to provide residents with an opportunity to develop work skills and secure employment prior to release. Originally consisting of 22 mixed-gender beds near Wichita State University, WWRF relocated and expanded capacity in 1978 and again in 1989. The 1990 Legislature appropriated funds to purchase and renovate a building in downtown Wichita, where WWRF is located today. In 1996, WWRF was administratively consolidated with WCF. In 2002, the female population was transferred to the Topeka Correctional Facility.
Consequences of Not Funding this ProgramAll expenditures for the Wichita Work Release Facility are recorded separately from expenses related to the operation of the Winfield Correctional Facility. Included in this program are the salaries and wages for unit staff, the deputy warden, support staff, unit team, and maintenance staff, as well as utilities, clothing, and other operating expenditures. Not funding for this program would result it the unit's closure. Program GoalsA. None; measures are included in administration, security, and classification & programs. TRANSPORTATIONTRANSPORTATIONKansas Department of TransportationAdministration ProgramProgram HistoryIn 1975, the Kansas Legislature established the Kansas Department of Transportation (KDOT) and transferred to it all the powers, duties, obligations, and functions of the preceding State Highway Commission. KSA 75-5015 authorizes the Secretary of Transportation to organize the Department in a manner considered most efficient and in accordance with other provisions of law. Prior to 2017, this program was previously referred to as Administration and Transportation Planning and included the subprograms known as Roads, Rail, and Water and Aviation Planning.
Program GoalsA. Stewardship: Continuously improve the quality of the transportation system and surrounding communities through strong partnerships and focused, lower cost and higher value improvements. B. Workforce: Get the best from our workforce by attracting and retaining talent; modeling diversity; supporting professional development; and inspiring action. Administration Program: AdministrationProgram HistoryThe Administration Subprogram provides general administrative services, such as financial and human resource management, inventory and procurement support, accounting and financial auditing, information technology support, program auditing, and facility and multimedia support. The Subprogram also coordinates public outreach through media, legislative, and intergovernmental relations. Please see the Administration Program page for related history.
Consequences of Not Funding this ProgramEliminating funding for this Subprogram would cause agency failure. Programs and subprograms would not have the necessary support to operate. This would include important functions such as bills would not be paid; information technology critical to agency operations would not be supported; required accounting, budgeting and auditing functions would not be performed; required human resource functions would not be performed, and public outreach would not exist. There would also be a loss of federal funding, as there would be no federal aid billing. This subprogram plays an important role in the development, support and delivery of the IKE program. As such, eliminating this subprogram would jeopardize program delivery. Program GoalsA. Provide the direction, planning, coordination, communication, and administrative support that foster an integrated, multimodal transportation system to meet the needs of Kansas. Performance Measures
Administration Program: Office of SecretaryProgram HistoryThe Office of the Secretary Subprogram establishes the goals and policy direction for the agency. It is also responsible for legal affairs of the agency and assures compliance with Title IV of the Civil Rights Act of 1964 and federal laws pertaining to the Disadvantaged Business Enterprises Program. Please see the Administration Program page for related history.
Consequences of Not Funding this ProgramEliminating funding would result in a loss of agency-wide direction and vision. Additionally, there would be no legal counsel on staff and no oversight to ensure the agency is managing its programs fairly and equitably. This subprogram plays an important role in the development, support, and delivery of the IKE program. As such, eliminating this subprogram would jeopardize program delivery. Program GoalsA. Provide the direction, planning, coordination, communication, and administrative support that foster an integrated, multimodal transportation system to meet the needs of Kansas. Performance Measures
Administration Program: Operations SupportProgram HistoryThe Operations Support Subprogram provides support to personnel, equipment, facilities, and agency support required for effective and efficient completion of transportation programs. The Subprogram also includes KDOT's safety operations, which instills a culture of safety throughout the agency's workforce. The Subprogram provides administrative and management support for the Regular Maintenance, Communications System - On Budget, and Construction Inspection subprograms. Please see the Administration Program page for related history.
Consequences of Not Funding this ProgramEliminating funding would result in reductions in agency support, including personnel, equipment and facilities. KDOT's ability to create safe work environments for its internal and external partners would be eliminated, as this subprogram includes KDOT safety operations. This subprogram plays an important role in the development, support and delivery of the IKE program. As such, eliminating this subprogram would jeopardize program delivery. Program GoalsA. Provide the direction, planning, coordination, communication, and administrative support that foster an integrated, multimodal transportation system to meet the needs of Kansas. Performance Measures
Construction ProgramProgram HistoryKSA 68-404 et seq. authorize the Secretary of Transportation to investigate all highway conditions and expend funds from the State Highway Fund and other appropriate sources in order to maintain or improve the state highway system. KSA 68-407 gives the Secretary the authority to enter into all contracts necessary for construction, improvement, or maintenance of highways. Selection of qualified consultants and quality control of services are addressed in KSA 75-5801 et seq. KSA 68-412a authorizes acquisition of right-of-way when the land is required for operation of the Department or the improvement of the state transportation system. Authority for the Department to own, construct, or maintain buildings is found in the Kansas Constitution, Article II, and KSA 68-404, 68-413, and 68-416. Prior to T-WORKS, some of the work currently classified as Preservation in this program was considered Substantial Maintenance and included as part of the Maintenance Program.
Program GoalsA. Asset Preservation: Address risks and maintain assets through investments that provide high value return and make best use of limited funds. B. Stewardship: Continuously improve the quality of the transportation system and surrounding communities through strong partnerships and focused, lower cost and higher value improvements. Construction Program: BuildingsProgram HistoryThe Buildings Subprogram develops and maintains the Capital Improvement Building Program. It provides for the maintenance and preservation of existing facilities, allows for the modernization of existing facilities, and construction of new facilities to meet current needs and improve efficiency and effectiveness of operations. Please see the Construction Program page for related history.
Consequences of Not Funding this ProgramThere would be no replacement of outdated or damaged buildings, no modernization of buildings to fit current equipment, and no ongoing maintenance for existing facilities. This would lead to inefficient and degraded road maintenance operations. Program GoalsA. Provide the direction, planning, coordination, communication, and administrative support that foster an integrated, multimodal transportation system to meet the needs of Kansas. Construction Program: Construction InspectionProgram HistoryThe Construction Inspection Subprogram develops the specific scope, schedule, and plans for construction and rehabilitation projects. It also provides project management, technical oversight, and coordination of all preconstruction activities for highway project development. Please see the Construction Program page for related history.
Consequences of Not Funding this ProgramEliminating funding for this Subprogram would cause project delays, cost overruns, and substandard work output by contractors. This would affect the safety of the state's roads and bridges. Program GoalsA. Develop and construct projects that continue to provide a quality state highway network that effectively meets the needs of the traveling public. Performance Measures
Construction Program: Debt ServiceProgram HistoryThe Debt Service Subprogram provides a portion of the necessary funding for the state's transportation programs. Please see the Construction Program page for related history.
Consequences of Not Funding this ProgramThe State would default on bond payments, increasing future borrowing costs. The State would lose an important source of financing for its transporation programs, which would require reducing the scope of transportation programs or finding other means of funding. Program GoalsA. Develop and construct projects that continue to provide a quality state highway network that effectively meets the needs of the traveling public. Construction Program: Design Right of WayProgram HistoryThe Design/Right of Way Subprogram develops the specific scope, schedule, and plans for construction and rehabilitation projects. It also provides project management, technical oversight, and coordination of all preconstruction activities for highway project development. Please see the Construction Program page for related history.
Consequences of Not Funding this ProgramConstruction and rehabilitation projects would not be built. This would affect the movement of goods and people throughout Kansas. There would also be a loss of federal funding. This subprogram plays an important role in the development, support and delivery of the IKE program. As such, eliminating this subprogram would jeopardize program delivery. Program GoalsA. Develop and construct projects that continue to provide a quality state highway network that effectively meets the needs of the traveling public. Performance Measures
Construction Program: ExpansionProgram HistoryExpansion projects are designed to improve safety, relieve congestion, improve access, and enhance economic development. Please see the Construction Program page for related history.
Consequences of Not Funding this ProgramProjects of this type would not be constructed. Potential loss of federal funding depending on the number of remaining qualifying projects in other categories. Program GoalsA. Develop and construct projects that continue to provide a quality state highway network that effectively meets the needs of the traveling public. Construction Program: Local ConstructionProgram HistoryThis Subprogram provides technical and administrative oversight of cities and counties in the utilization of state and federal dollars made available for the development and construction of transportation projects. Please see the Construction Program page for related history.
Consequences of Not Funding this ProgramCities and Counties would lose funding. In addition, federal funding for the State could be jeopardized. Program GoalsA. Assist in providing safe, efficient, and reliable local transportation systems. Performance Measures
Construction Program: ModernizationProgram HistoryModernization projects are designed to bring a roadway or intersection up to current design standards. Examples include rehab/replacement of pavement, eliminating steep hills or sharp curves. Modernization also includes associated bridge work, such as widening narrow bridges or replacing obsolete bridges. Please see the Construction Program page for related history.
Consequences of Not Funding this ProgramProjects of this type would not be constructed. Potential loss of federal funding depending on the number of remaining qualifying projects in other categories. Program GoalsA. Develop and construct projects that continue to provide a quality state highway network that effectively meets the needs of the traveling public. Construction Program: PreservationProgram HistoryThis Subprogram preserves the public investment in the State transportation system by maintaining the components, as near as possible, in their as-built condition. Please see the Construction Program page for related history.
Consequences of Not Funding this ProgramThe system without ongoing preservation efforts will deteriorate at an ever increasing rate until it must be replaced at a greater cost than preserving what currently exists. Potential loss of federal funding depending on the number of remaining qualifying projects in other categories. Program GoalsA. Preserve the State Highway System as-built or in an improved condition providing safe and reliable highway facilities. Performance Measures
Local Support ProgramProgram HistoryKSA 68-402b authorizes counties, cities, and other local governments to enter into contracts with the Secretary of Transportation for federal funds and establishes the procedures for their distribution. Distribution of the Special City and County Highway Fund and the County Equalization and Adjustment Fund is provided in KSA 79-3425 and 79-3425(c), respectively. Local Support used to include Traffic Safety, Public Transportation Assistance, and Categorical Aid subprograms in addition to the subprograms included in this section. Traffic Safety and Public Transportation Assistance became part of the Transportation Planning and Modal Support Program. The Categorical Aid subprogram was abolished.
Program GoalsA. Asset Preservation: Address risks and maintain assets through investments that provide high value return and make best use of limited funds. Local Support Program: Local ProjectsProgram HistoryThe Local Projects Subprogram assists cities and counties in the utilization of state and federal transportation dollars that are made available to them. It also administers the Federal Funds Exchange Program, the National Bridge Inspection Program, the Cost-Share Program and the Kansas Local Bridge Improvement Program. Please see the Local Support program page for related history.
Consequences of Not Funding this ProgramKDOT would no longer have the means to address community transportation needs and emerging opportunities through partnerships that provide input, collaboration and funding. KDOT would no longer be able to assist local communities in mazimizing financial aid. Eliminating funding for this subprogram would result in the loss of federal funds. This subprogram plays an important role in the development, support and delivery of the IKE program. As such, eliminating this subprogram would jeopardize program delivery. Program GoalsA. Assist in providing safe, efficient, and reliable local transportation systems. Performance Measures
Local Support Program: Special City & County Highway AidProgram HistoryThis subprogram contains expenditures from the Special City and County Highway Fund and County Equalization Adjustment Fund. Distribution of funding is administered by the State Treasurer's Office. Please see the Local Support program page for related history.
Consequences of Not Funding this ProgramCities and counties would lose state transportation funding, affecting both local and state economies. Program GoalsA. Assist in providing safe, efficient, and reliable local transportation systems. Maintenance ProgramProgram HistoryKSA 68-407 empowers the Secretary of Transportation to perform all work or to contract for the construction, improvement, or maintenance of the state highway system. KSA 68- 406a and 68-412 provide for the designation and improvement of city connecting links. KSA 68-416 requires the Secretary to apportion annually and distribute quarterly to cities $5,000 per lane-mile per year for the maintenance of city connecting links. KSA 68-416a provides for the designation of responsibilities for maintenance of city connecting links. KSA 8-1559 assigns authority to the Secretary of Transportation to set speed limits. KSA 68-404 and 68-415 provide for the Secretary to control entrances on state highways, and KSA 8-1911 provides authority to the Secretary to issue oversize or overweight permits to commercial motor carriers.
Program GoalsA. Transportation System Management: Maximize performance of the existing system by investing in transportation choices and smart assets. B. Asset Preservation: Address risks and maintain assets through investments that provide high value return and make best use of limited funds. C. Stewardship: Continuously improve the quality of the transportation system and surrounding communities through strong partnerships and focused, lower cost and higher value improvements. Maintenance Program: Communication SystemProgram HistoryThe Subprogram is responsible for repairing and servicing radio equipment at the tower sites strategically located across the state. Please see the Maintenance Program page for related history.
Consequences of Not Funding this ProgramEliminating funding for this subprogram would cause communication failures between state and local partners, including public safety entities. There would be no maintenance of the system, which would cause it to deteriorate and be more costly to repair. Program GoalsA. Maintain an interoperable statewide 800MHz radio system to allow local units of government and other potential users onto the system. Performance Measures
Maintenance Program: Regular MaintenanceProgram HistoryThis subprogram preserves and repairs the state roadway system. System elements include travelway surfaces, shoulders, roadsides, drainage facilities, bridges, signs and pavement markings. Maintenance activities are undertaken to offset the effects of deterioration, damage, and vandalism. Traffic services such as lighting and signal operation, snow and ice removal, and operation of roadside rest areas are also provided. Please see the Maintenance Program page for related history.
Consequences of Not Funding this ProgramEliminating funding for this subprogram would result in failure of the roadway system. This would slow or prevent the movement of people and goods throughout Kansas, which would damage the state's economy and reduce the quality of life for citizens. Eliminating funding for this subprogram would also increase long term costs. Poorly maintained roads cost more to rehabilitate and repair compared to well maintained roadways. Program GoalsA. Preserve the State Highway System as-built or in an improved condition providing safe and reliable highway facilities. Performance Measures
Transportation Planning & Modal Support ProgramProgram HistoryThis program was created in 2017 and includes subprograms from what was previously known as Administration and Transportation Planning Program and Local Support Program. The Transportation Planning Subprogram was previously a large portion of the Roads, Rail, and Water Subprogram found in the Administration and Transportation Planning Program. Traffic Safety and Transit were previously part of the Local Support Program. The Rail and Freight Subprogram was created from parts previously known as the Roads, Rail, and Water Subprogram; Public Transportation Assistance Subprogram; and the Categorical Aid Subprogram. Aviation includes the subprogram previously referred to as Aviation Planning, which was part of the program previously known as Administration and Transportation Planning, and it includes state and federal aid previously found in the Categorical Aid program. KSA 75-5025 et seq. authorize the Secretary to accept and utilize federal funds for railroad revitalization. KSA 75-5033 makes provision for public transportation for the elderly, the disabled, and the general public. KSA 75-5061 authorizes general aviation funding.
Program GoalsA. Safety and Security: Enhance the safety and security of the transportation system for all users and workers. B. Transportation System Management: Maximize performance of the existing system by investing in transportation choices and smart assets. C. Economic Vitality: Improve reliability and increase flexibility for cost-efficient movement of people, goods, and information to bolster the Kansas economy. D. Stewardship: Continuously improve the quality of the transportation system and surrounding communities through strong partnerships and focused, lower cost and higher value improvements. Performance Measures
Transportation Planning & Modal Support Program: AviationProgram HistoryThe Aviation Subprogram provides funding and technical assistance to local airports; drives economic development and enhances critical services in Kansas through infrastructure improvement; and serves as the state aviation expert, innovator, and resource for the Kansas aviation community. Please see the Transportation, Planning and Modal Support Program page for related history.
Consequences of Not Funding this ProgramThere would be no statewide coordination of growing aviation capacity and capabilities, including unmanned arial vehicle (UAV) development. There would be a loss of federal and state funding for local airports. Eliminating funding for this Subprogram would affect an important segment of the Kansas economy by reducing access to jobs, services and products of existing and emerging economic and social centers. Program GoalsA. Provide planning, coordination, and assistance to ensure a safe, efficient, and reliable multimodal transportation network on and off the State Highway System. Performance Measures
Transportation Planning & Modal Support Program: Innovative TechnologiesProgram HistoryThe Innovation Technologies Subprogram provides financial assistance to partners for innovative technology projects that improve safety, leverage State funds to increase total technology investment, and help both rural and urban areas of the State improve the transportation system. It also provides funding for the Broadband Acceleration Grant Program and assistance to the Kansas Office of Broadband Development for the purpose of deploying broadband to underserved areas of the State.
Consequences of Not Funding this ProgramAdvances in transportation would be curtailed, including advances that promote safety, improve access or mobility, or implement new transportation technology. The expansion of broadband in Kansas would be greatly diminished. Transportation Planning & Modal Support Program: Rail & FreightProgram HistoryThe Rail and Freight Subprogram collects and analyzes multimodal freight transportation data to make programming recommendations for projects that improve freight flows and create economic development opportunities. In addition, funding is provided for infrastructure improvements to the state rail system. Please see the Transportation, Planning and Modal Support Program page for related history.
Consequences of Not Funding this ProgramKDOT would no longer be able to optimize the movement of goods and access to markets, which would affect an important segment of the Kansas economy. There would be a lack of data to make informed decisions on freight system improvements. Additionally, there would be a loss of federal rail and freight funding. Program GoalsA. Provide planning, coordination, and assistance to ensure a safe, efficient, and reliable multimodal transportation network on and off the State Highway System. Performance Measures
Transportation Planning & Modal Support Program: Traffic SafetyProgram HistoryThe Traffic Safety Subprogram manages safety programs designed to reduce crashes and serious injuries and fatalities in motor vehicle crashes. Priority areas include increasing seat belt usage, reducing impaired driving, reducing distracted driving, reducing motorcycle fatalities, and improving traffic safety data sharing. Please see the Transportation, Planning and Modal Support Program page for related history.
Consequences of Not Funding this ProgramEliminating funding would increase the potential for a higher number of crashes, injuries and fatalities in Kansas. KDOT would no longer have the means to use education, enforcement, and engineering to reduce the severity of crashes and reduce the number of travel-related deaths toward zero. Not funding this Subprogram would also result in the loss of federal funds. This subprogram plays an important role in the development, support and delivery of the IKE program. As such, eliminating this subprogram would jeopardize program delivery. Program GoalsA. Provide planning, coordination, and assistance to ensure a safe, efficient, and reliable multimodal transportation network on and off the State Highway System. Performance Measures
Transportation Planning & Modal Support Program: TransitProgram HistoryThe Transit Subprogram administers state and federal public transit programs to help meet the needs of elderly persons, persons with disabilities, and the general public. Please see the Transportation, Planning and Modal Support Program page for related history.
Consequences of Not Funding this ProgramEliminating funding would reduce public transit services provided across the state. This would reduce access to jobs, services and products in existing and emerging economic and social centers. There would also be a loss of federal transit funding. Program GoalsA. Provide planning, coordination, and assistance to ensure a safe, efficient, and reliable multimodal transportation network on and off the State Highway System. Performance Measures
Transportation Planning & Modal Support Program: Transportation PlanningProgram HistoryThe Transportation Planning Subprogram is responsible for collecting, analyzing, modeling and forecasting information for the statewide transportation system. Major areas of responsibility include traffic counting and classification, geometric data, advanced analytics, cartography and geographic information systems. Other important areas include long range planning, metropolitan planning, access management, statewide systems evaluation, public transportation, pedestrian and bicycle transportation, and developing and coordinating state policy on freight and rail transportation issues. The Subprogram also develops, designs, selects, and manages projects and ensures the state is meeting federal requirements. Please see the Transportation, Planning and Modal Support Program page for related history.
Consequences of Not Funding this ProgramKDOT would no longer be able to acquire and analyze the information needed to develop long-range transportation programs that are consistent with the needs of the public. Eliminating funding would also result in the loss of federal funds. Program GoalsA. Provide planning, coordination, and assistance to ensure a safe, efficient, and reliable multimodal transportation network on and off the State Highway System. Performance Measures
| |||||||||||||||||||||||||||||||||||||||||||||||||||||||||||||||||||||||||||||||||||||||||||||||||||||||||||||||||||||||||||||||||||||||||||||||||||||||||||||||||||||||||||||||||||||||||||||||||||||||||||||||||||||||||||||||||||||||||||||||||||||||||||||||||||||||||||||||||||||||||||||||||||||||||||||||||||||||||||||||||||||||||||||||||||||||||||||||||||||||||||||||||||||||||||||||||||||||||||||||||||||||||||||||||||||||||||||||||||||||||||||||||||||||||||||||||||||||||||||||||||||||||||||||||||||||||||||||||||||||||||||||||||||||||||||||||||||||||||||||||||||||||||||||||||||||||||||||||||||||||||||||||||||||||||||||||||||||||||||||||||||||||||||||||||||||||||||||||||||||||||||||||||||||||||||||||||||||||||||||||||||||||||||||||||||||||||||||||||||||||||||||||||||||||||||||||||||||||||||||||||||||||||||||||||||||||||||||||||||||||||||||||||||||||||||||||||||||||||||||||||||||||||||||||||||||||||||||||||||||||||||||||||||||||||||||||||||||||||||||||||||||||||||||||||||||||||||||||||||||